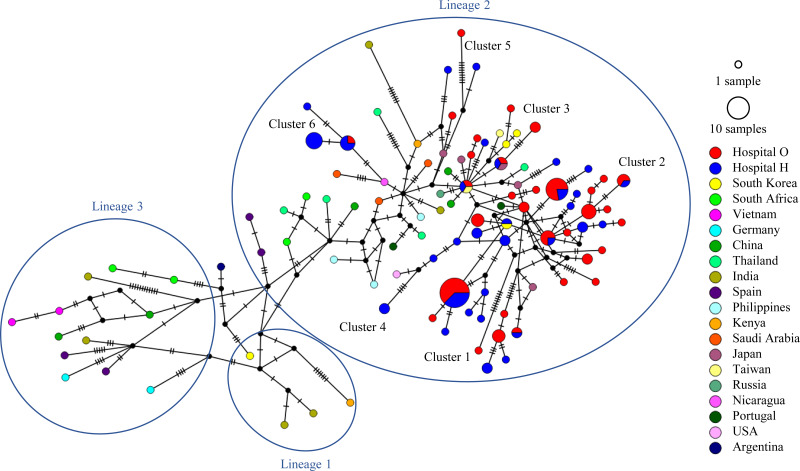
FIG 5.
HRSV-B BA9 median-joining network based on the sequences of the second HVR of G depicting the relationship between clusters and lineages. The internodal line lengths are proportional to the number of mutations. The size of the circles represents the number of strains with matching sequences. Strains circulating in different countries are color coded. Strains detected at hospital O are shown in red, and those detected at hospital H are shown in blue.

