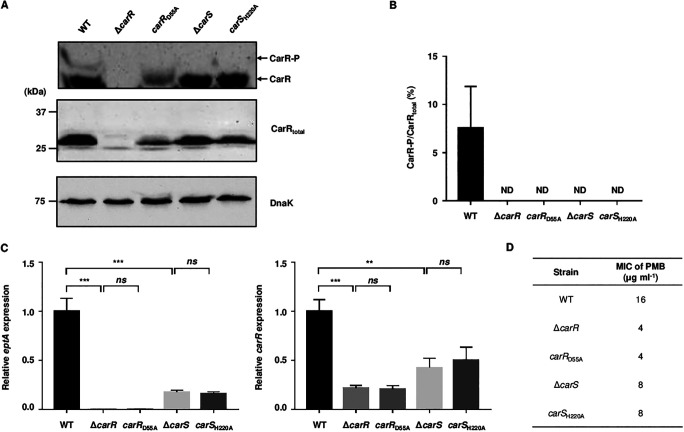
FIG 4.
Roles of D55 of CarR and H220 of CarS in CarR phosphorylation, gene regulation, and PMB resistance. (A to C) Total proteins and RNAs were isolated from the V. vulnificus strains grown to an A600 of 0.5. (A) The phosphorylation status of CarR was determined by Western blot analysis using Phos-tag SDS-PAGE gel (Wako). The cellular levels of CarRtotal and DnaK (as an internal control) were determined by Western blot analysis using standard SDS-PAGE gel. Molecular size markers (Bio-Rad) are shown in kDa. (B) The intensities of the protein bands were quantified using Image Lab software (Bio-Rad). ND, not detected. (C) The eptA and carR transcript levels were determined by qRT-PCR, and the transcript level of each gene in the wild type was set at 1. (D) The MICs of PMB in the V. vulnificus strains were determined using the broth microdilution method. Error bars represent the SD from three independent experiments. Statistical significance was determined by Student’s t test. **, P < 0.005; ***, P < 0.001; ns, not significant; WT, wild type; ΔcarR; carR mutant; carRD55A, a mutant producing CarRD55A; ΔcarS, carS mutant; carSH220A, a mutant producing CarSH220A.

