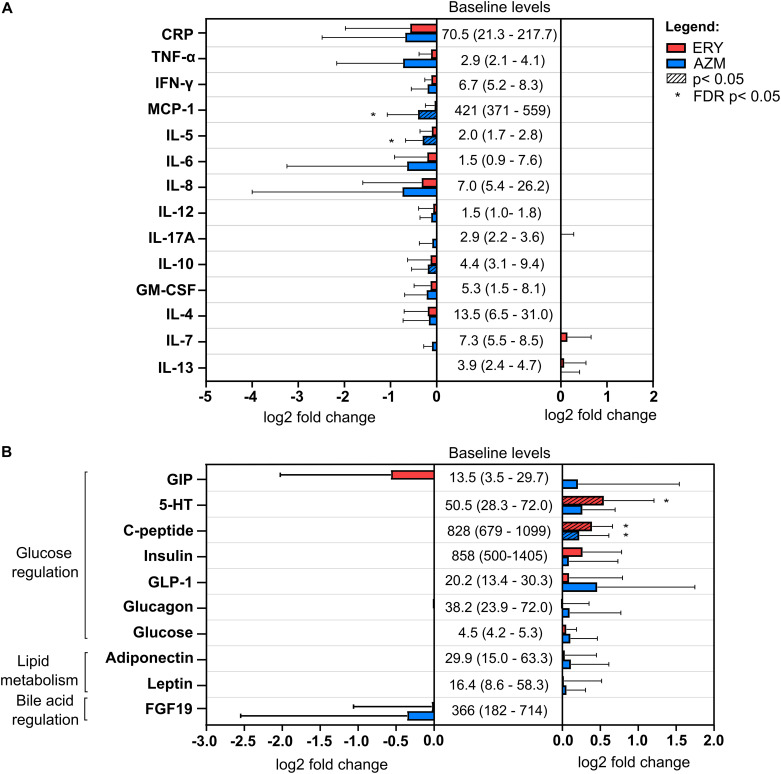
FIG 1.
Changes in serum levels of (A) systemic immune markers and (B) metabolic biomarkers associated with glucose regulation, lipid metabolism and bile acid regulation in erythromycin (ERY) and azithromycin (AZM) groups in humans. Baseline levels of each serum biomarker were based on the mean and standard deviation at baseline across all participants (n = 20). All values are in pg/mL except for 5-HT (ng/mL), glucose (mmol/L), adiponectin (μg/mL), leptin (ng/mL), and C-reactive protein (CRP, ng/mL). Serum biomarkers were measured using commercially available single and multiplex immunoassay panels as described in the Methods section. Bar graph and error bars represent the mean fold change (log2) and standard deviation of biomarker levels at the end of the antibiotic treatment compared to their respective baseline values. Pairwise comparisons were performed using a linear mixed model (lme4 v1.1-23 and lmerTest v3.1-1 packages in R). Statistical significance (P < 0.05) following correction for multiple testing using the false discovery rate (FDR) method is indicated by an asterisk (*).

