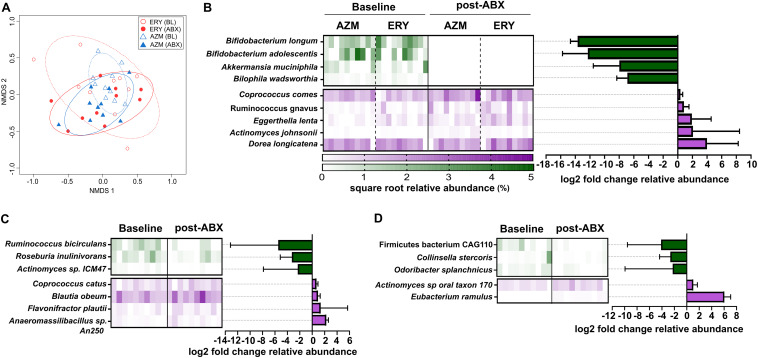
FIG 2.
(A) Nonmetric multidimensional plot based on fecal microbiota before (baseline, BL) and after 4 weeks of erythromycin or azithromycin treatment (ABX). Ellipses for each group represent the standard deviation with 80% confidence limit (dotted and solid lines represent baseline and tretment groups, respectively). (B to D) Microbial species that were significantly altered by both erythromycin and azithromycin treatment in humans, and those that were altered either by (C) erythromycin or (D) azithromycin. Heatmap represents the square root relative abundances of samples within each group; bar graphs represent the (log2) fold change in the relative abundance of specific taxa between baseline and the end of 4 weeks of macrolide treatment. Bars and error bars depict the median and interquartile ranges. Significance was determined based on the Wilcoxon test at FDR P < 0.05 for comparisons involving both erythromycin and azithromycin groups, and P < 0.05 for agent-specific comparisons.

