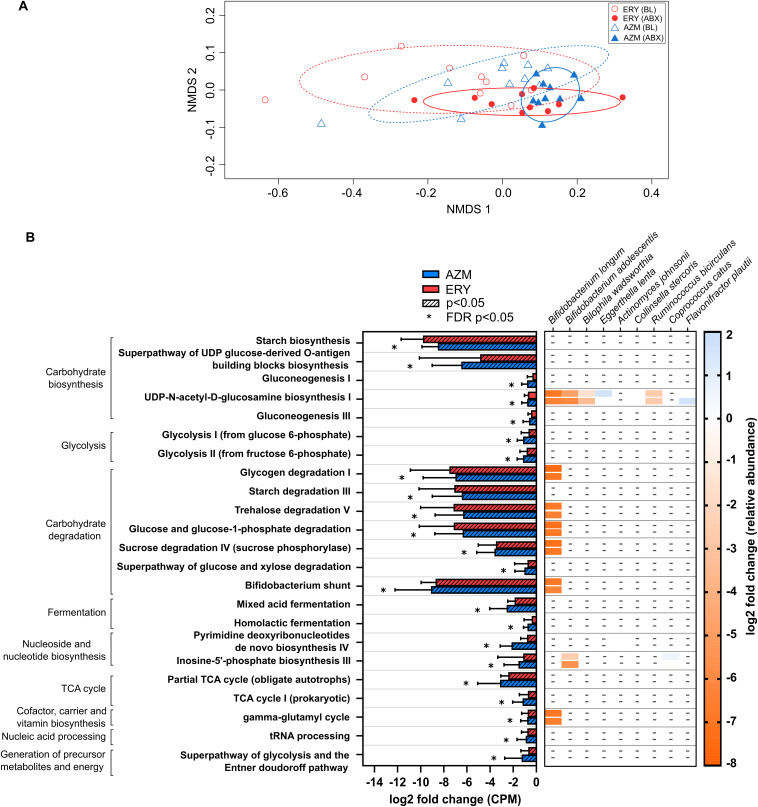
FIG 3.
(A) Nonmetric multidimensional scaling ordination plot of bacterial functional pathway abundance in humans following treatment with azithromycin or erythromycin for 4 weeks. Ellipses for each group represent the standard deviation with 80% confidence limit (dotted and solid lines represent baseline and treatment groups, respectively). (B) Pairwise comparison between baseline and the end of erythromycin (ERY) and azithromycin (AZM) treatment was performed using the Wilcoxon test, and P values were corrected for multiple comparisons using the FDR method. Only pathways that were significantly altered by a 1.5-fold change (log2 average fold change > |0.58| and FDR P < 0.05) compared to the respective baseline abundance, either in the erythromycin or azithromycin group, are shown. Bars and error bars represent the median and interquartile ranges. Stratification of pathways based on bacterial species that were significantly altered by either erythromycin or azithromycin is shown using a heatmap. None of the taxonomically stratified pathways were significantly altered with treatment. Pathway abundance (counts per million, CPM) were determined using the Human Microbiome Project Unified Metabolic Analysis Network (HUMAnN3) tool and annotated based on the Metacyc Metabolic Pathway database.

