FIG 4.
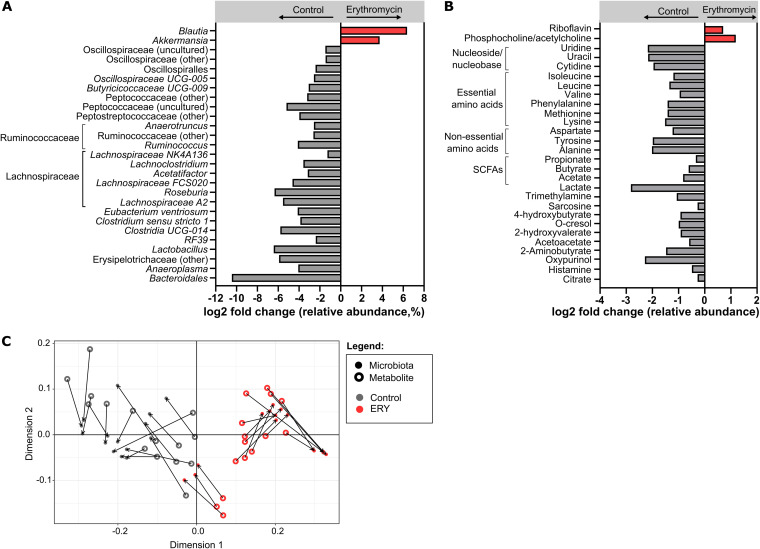
(A) Bacterial taxa and (B) metabolites that were significantly altered in fecal samples of erythromycin-treated mice compared to control mice at day 90. Each bar represents the log2 average fold change of bacterial taxa (or metabolites) that were significantly higher (in red) or significantly lower (in gray) in erythromycin-treated compared to control mice. (C) Fecal samples of the erythromycin-treated (red symbols) and control mice (gray symbols) were ordinated based on their microbiota composition (closed circles) and metabolite composition (open circles) using Procrustes analysis. The line connecting the closed and open circles represents the distance between microbiota and metabolite samples, respectively, of each mouse. Statistical comparisons of bacterial taxon and metabolite abundances between the groups were performed using the Mann-Whitney test and unpaired t test, respectively. Bacterial taxa that were significantly altered with FDR-adjusted P < 0.01 and a fold change of 1.5, as well as significantly altered metabolites (FDR P < 0.05), are shown.

