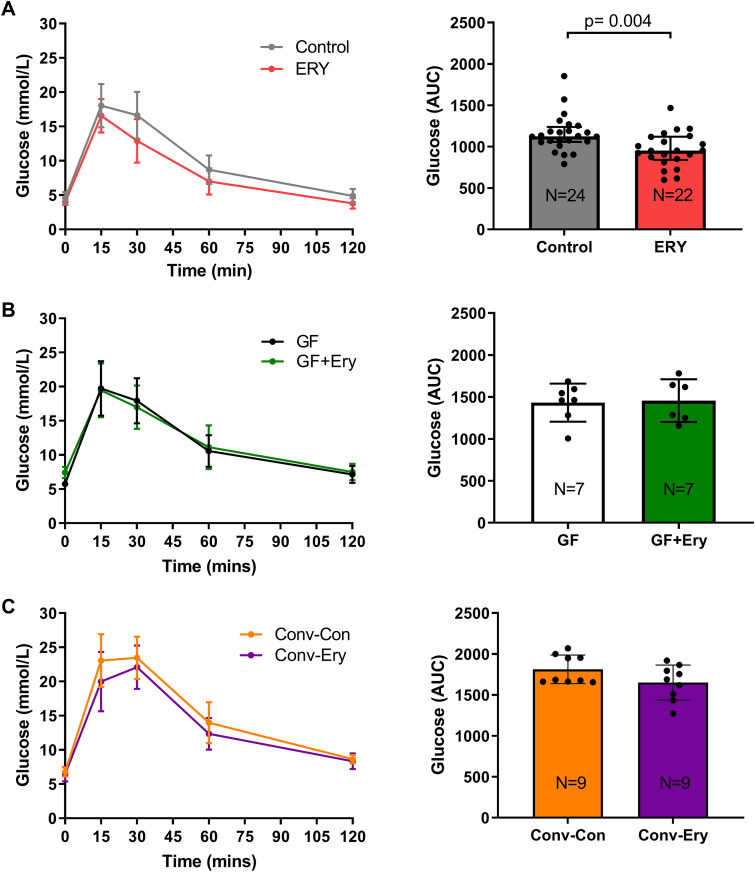
FIG 5.
Blood glucose and the glucose area under the curve (AUC) during a 2-h intraperitoneal glucose tolerance test (IPGTT) at day 90 in (A) mice that received erythromycin (20 mg/kg) or water (n = 22 for ERY and n = 24 for control, respectively), (B) germ-free mice that received erythromycin (20 mg/kg) or water (n = 7 per group), and (C) germ-free mice transplanted with erythromycin-associated microbiota or control microbiota (n = 9 per group). Data are presented as the mean and the error bars represent standard deviation. Statistical comparisons between groups were performed using the Mann-Whitney test, with significance at P < 0.05.

