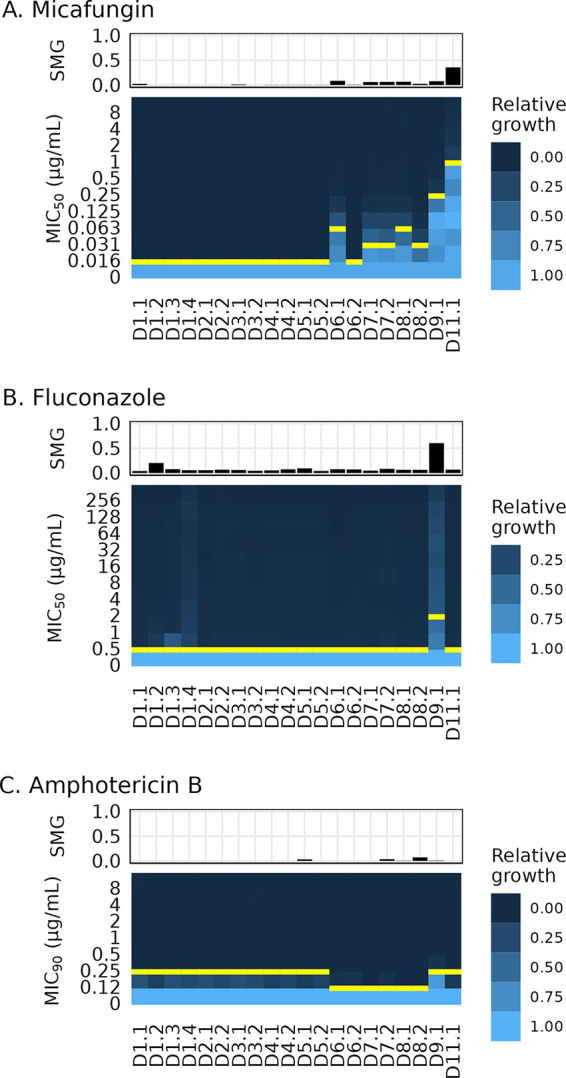
FIG 2.

Decreased drug susceptibility and tolerance appeared within 9 days of echinocandin monotherapy during C. lusitaniae infection. Heatmaps of relative growth at increasing concentrations of antifungal drug (MICs) and bar charts of tolerance (supra-MIC growth [SMG]) for three drug classes. The MIC is marked with a yellow bar for each isolate. MIC50 is the lowest concentration of drug that decreased the 24-h growth to less than 0.5 of the growth of the no-drug control, and MIC90 is the lowest concentration of drug that decreased the 24-h growth to less than 0.9 of the growth of the no-drug control (see Materials and Methods). SMG is the proportion of growth at 48 h in all wells with drug concentrations above the MIC relative to the growth of the no-drug control. (A) Micafungin (MCF) SMG and MIC50. (B) Fluconazole (FLC) SMG and MIC50. (C) Amphotericin B (AMB) SMG and MIC90. Each plot represents the average values from 3 independent assays.
