FIG 3.
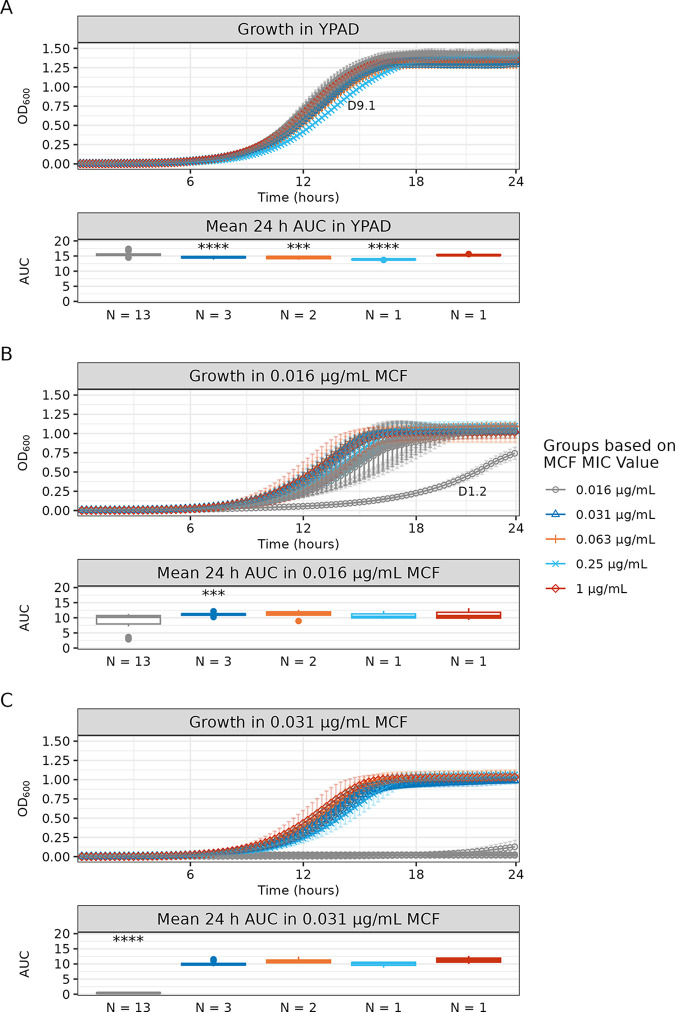
The isolate with the greatest increase in the micafungin MIC value did not have a significant fitness cost relative to the fitness of drug-sensitive isolates. Shown are the 24-h growth curve and a box plot of the mean 24-h area under the logistic curve (AUC-L) values for all serial isolates in the absence and presence of micafungin (MCF). Isolates are grouped by MCF MIC results. The number of isolates per group is indicated on the x axis of each box plot. (A) Growth and mean AUC-L values in YPAD medium. (B) Growth and mean AUC-L values in 0.016 μg/mL MCF. A single isolate (D1.2) did not reach stationary phase and is labeled on the growth curve. (C) Growth and mean AUC-L values in 0.031 μg/mL MCF. Groups with any statistically significant difference in pairwise comparison of mean values are marked by asterisks in the box plot (***, P ≤ 0.001; ****, P ≤ 0.0001; see Table S3 for all statistical comparisons). Growth curves were performed in triplicate; mean slope values and standard deviations are shown. See Table S3 for growth curve summary statistics, Welch’s ANOVA omnibus testing of group mean AUC-L values, and Games-Howell post hoc pairwise testing.

