
Fig. 5.
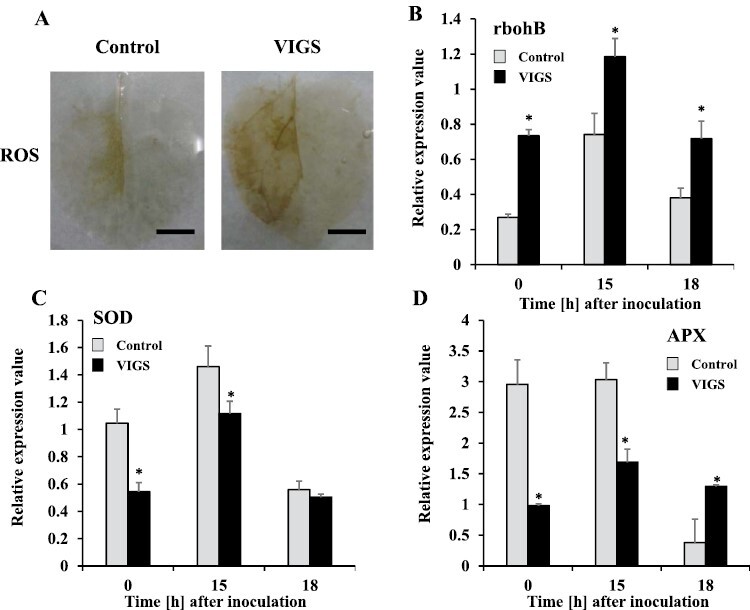
Hyper-production of reactive oxygen species during accelerated HR in NbPLC3s-silenced plants. Empty vector control and NbPLC3s-silenced plant leaves were infiltrated with R. solanacearum strain 8107. (A) ROS production visualized 18 h after inoculation as assessed by DAB staining. These experiments were repeated with 10 biological replicates, and representative results are shown. Scale bars=1 cm. (B–D) Total RNA was isolated from control and NbPLC3s-silenced plants at 0, 15, and 18 h after inoculation with R. solanacearum 8107. Expression values of rbohB, APX1 and SOD are shown as relative expression after normalization to internal standard genes (NbUbe35/NbNQO). Values represent means ±SD from triplicate experiments. Asterisks denote values significantly different from those of control plants (*; P<0.05, t-test).