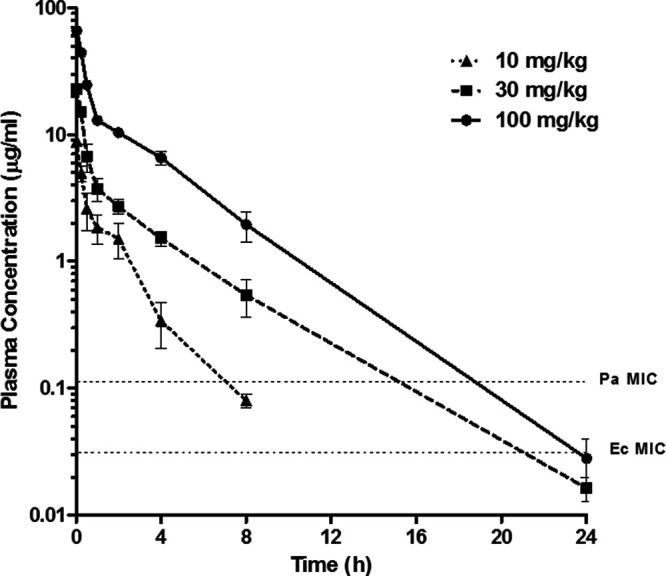
FIG 1.

Mean plasma concentration-time profiles of ciprofloxacin in neutropenic infected rats following single i.v. bolus doses of 10 mg/kg (triangles), 30 mg/kg (squares), and 100 mg/kg (circles). Error bars represent the SEM. The dashed horizontal lines represent the MIC concentrations of ciprofloxacin against Ec (Escherichia coli [ATCC 25922]) and Pa (Pseudomonas aeruginosa [ATCC 27853]).
