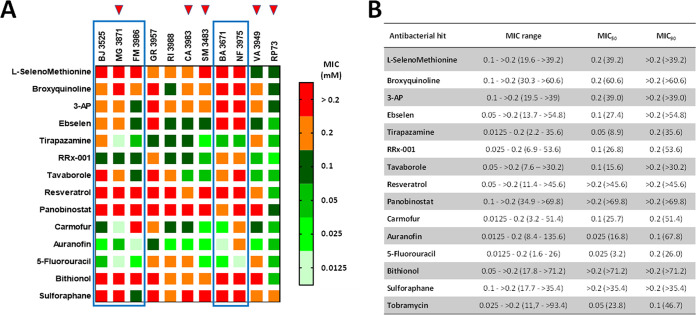
FIG 3.
In vitro activity of selected antibacterial hits against P. aeruginosa strains from CF patients. (A) Heat map of MIC data for the tested hit compounds. The values, expressed as millimolar concentrations, are color-coded, and color bars mark the matrix positions of compounds in a particular P. aeruginosa strain. Boxed are strains with strong pyocyanin, pyoverdine and protease production, while red triangles indicate MDR strains. (B) MIC range and the lowest concentrations that inhibited 50% and 90% of the tested strains (MIC50 and MIC90, respectively), expressed as millimolar concentrations (micrograms per milliliter).

