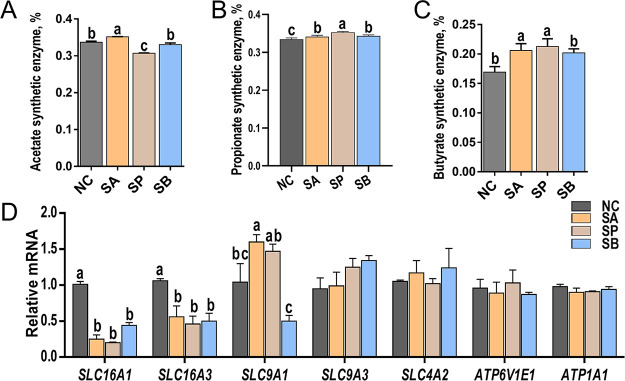
FIG 2.
Relative abundances of SCFA synthetic enzymes and relative expression levels of SCFA transporter genes. Representative charts show the relative abundances of acetate synthetic enzymes (EC 6.3.4.3, EC 1.5.1.5, and EC 1.5.1.20) (A), propionate synthetic enzymes (EC 5.4.99.25, EC 5.1.99.1, and EC 6.2.1.1) (B), and butyrate synthetic enzymes (EC 2.3.1.9, EC 1.1.1.157, and EC 4.2.1.17) (C) of four groups in rumen fluid. Data were calculated based on the PICRUSt2 analysis of 16S rRNA sequencing, and the relative abundances of SCFA synthetic enzymes were the sum of the abundances of the genes that encoded the key enzymes. (D) Relative expression levels of SLC16A1, SLC16A3, SLC9A1, SLC9A3, SLC4A2, ATP6V1E1, and ATP1A1 genes of rumen epithelial tissue determined using RT-PCR. Mean values with different letters are significantly different (P < 0.05) according to Duncan’s multiple-range test. Data are shown as means ± the SD (n = 6/group).

