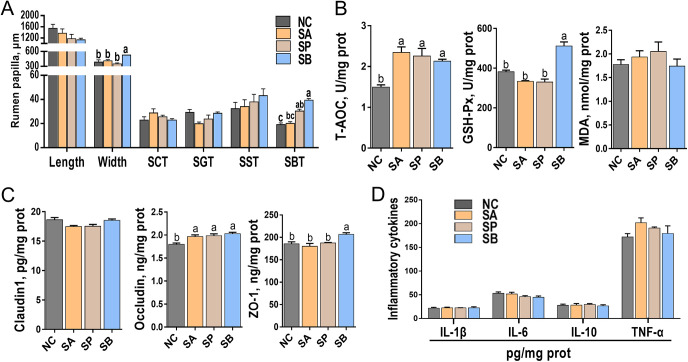
FIG 3.
Development of rumen papilla, antioxidant capacity parameters, and concentrations of tight junctions and inflammatory cytokines of rumen epithelial tissue. (A) Representative charts of the length and width of rumen papilla, SCT, SGT, SST, and SBT. (B) Representative charts of T-AOC, the activity of GSH-Px, and the content of MDA of rumen epithelium. (C) Representative charts of the activities of Claudin1, occludin, and ZO-1 of rumen epithelium. (D) Representative charts of the activities of IL-1β, IL-6, IL-10, and TNF-α of rumen epithelium. Mean values with different letters are significantly different (P < 0.05) according to Duncan’s multiple-range test. Data are shown as means ± the SD (n = 6/group).

