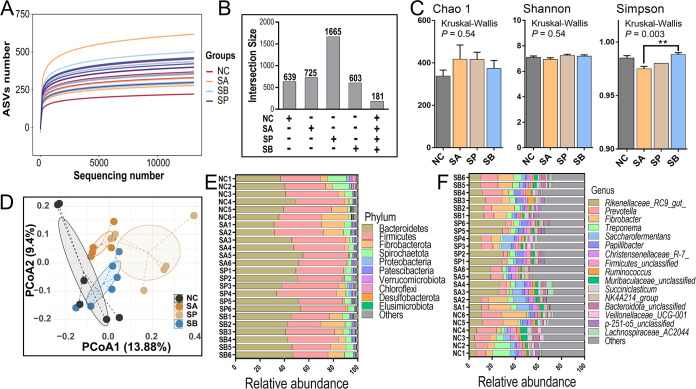
FIG 4.
Rumen bacterial diversities and compositions. (A) Diagram of the rarefaction curve of rumen bacteria. (B) UpSet diagram of the numbers of unique or shared ASVs in rumen fluid of four groups. (C) Representative charts of microbial α-diversity indexes of Chao1, Shannon, and Simpson indexes. Data are shown as means ± the SD, while statistical analyses were conducted using Kruskal-Wallis tests (**, P < 0.01). (D) PCoA of microbial β-diversity calculated using unweighted UniFrac distances. (E and F) Component proportions of rumen bacteria in phylum and genus levels.

