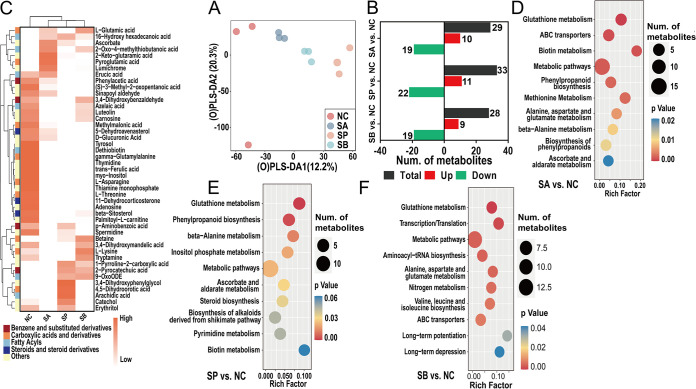
FIG 6.
Metabolome profiles and the functional enrichment analysis of rumen fluid. (A) Distributions of LC-MS metabolome data using an OPLS-DA score plot. (B) Number of differential metabolites of three comparisons. (C) Cluster heatmap of the differential metabolites and the classification information. (D to F) Functional enrichment analysis of differential metabolites using KEGG database of three comparisons.

