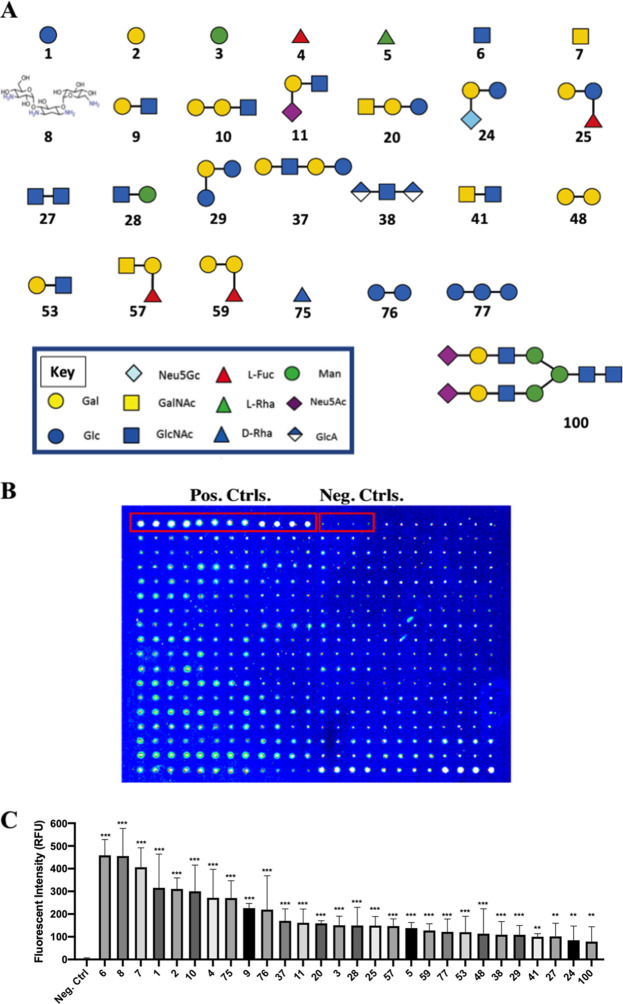
FIG 2.
Analysis of glycan binding by P. aeruginosa PAO1 using the Glycan-100 array. GFP-expressing P. aeruginosa PAO1 was quantitatively assessed for binding to known glycan structures printed on the Glycan-100 array. (A) Structures of the 28 compounds significantly bound by P. aeruginosa PAO1. The numbering of the compounds corresponds to that used in the text and the Glycan-100 array. The structures were modified with permission from the figures at https://www.raybiotech.com/. (B) Representative example of one of the arrays tested for glycan binding by P. aeruginosa. The positive control (a fluorescent protein) and negative control (nothing spotted) are labeled and indicated by the red boxes. (C) Glycan array analysis revealed that P. aeruginosa PAO1 cells significantly bound 28 distinct glycans in this assay. The average fluorescence intensity associated with each glycan was compared to that of the negative control. The number on the x axis corresponds to the numbering in the text and in panel A of this figure. Data were analyzed using one-way analysis of variance (ANOVA) with Dunnett’s post hoc analysis and are derived from three independent experiments with quadruple spotting of each glycan on each array (n = 12). ***, P ≤ 0.0005; **, P ≤ 0.005.

