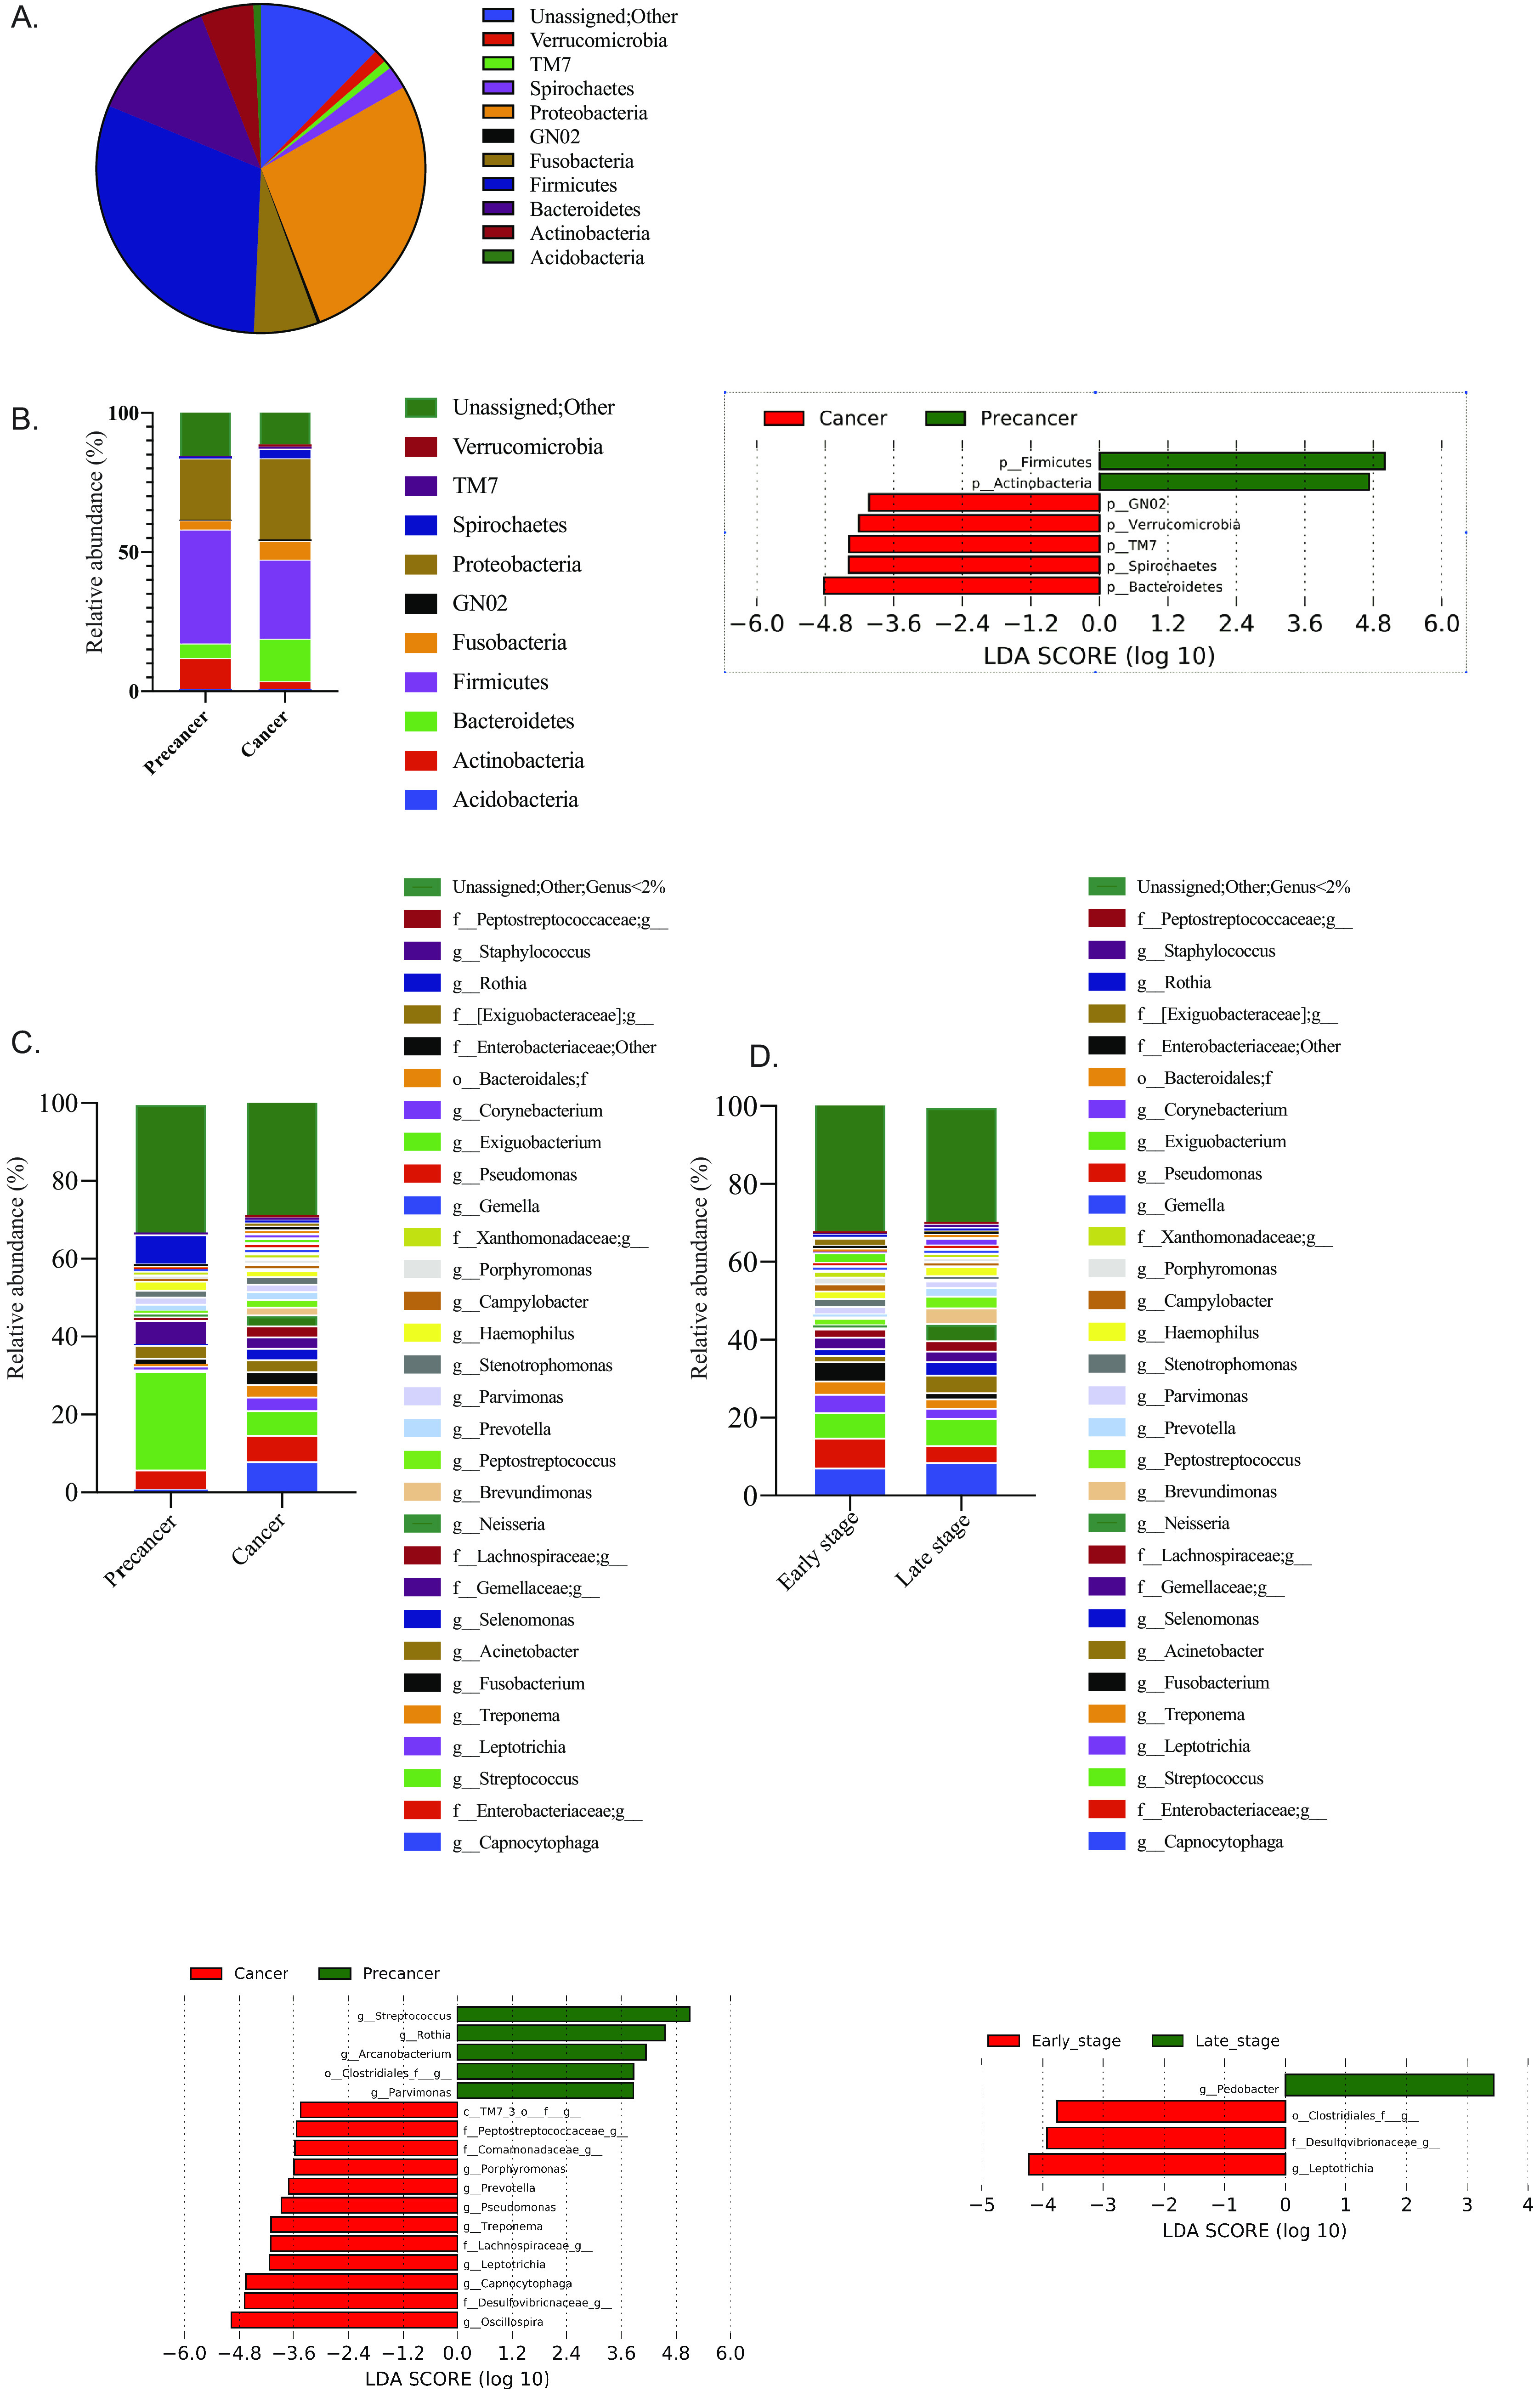
FIG 2.

Taxonomic composition of microbiota in OSCC. (A) Relative abundances of core bacterial phyla in the present data set. (B) Relative and differential abundances of core bacterial phyla among precancer and cancer groups. (C) Relative and differential abundances of core bacterial genera among precancer and cancer groups. (D) Relative and differential abundances of core bacterial genera among early cancer and late cancer stages. Differential abundance analysis was done by LEfSe and represented through LDA plot.
