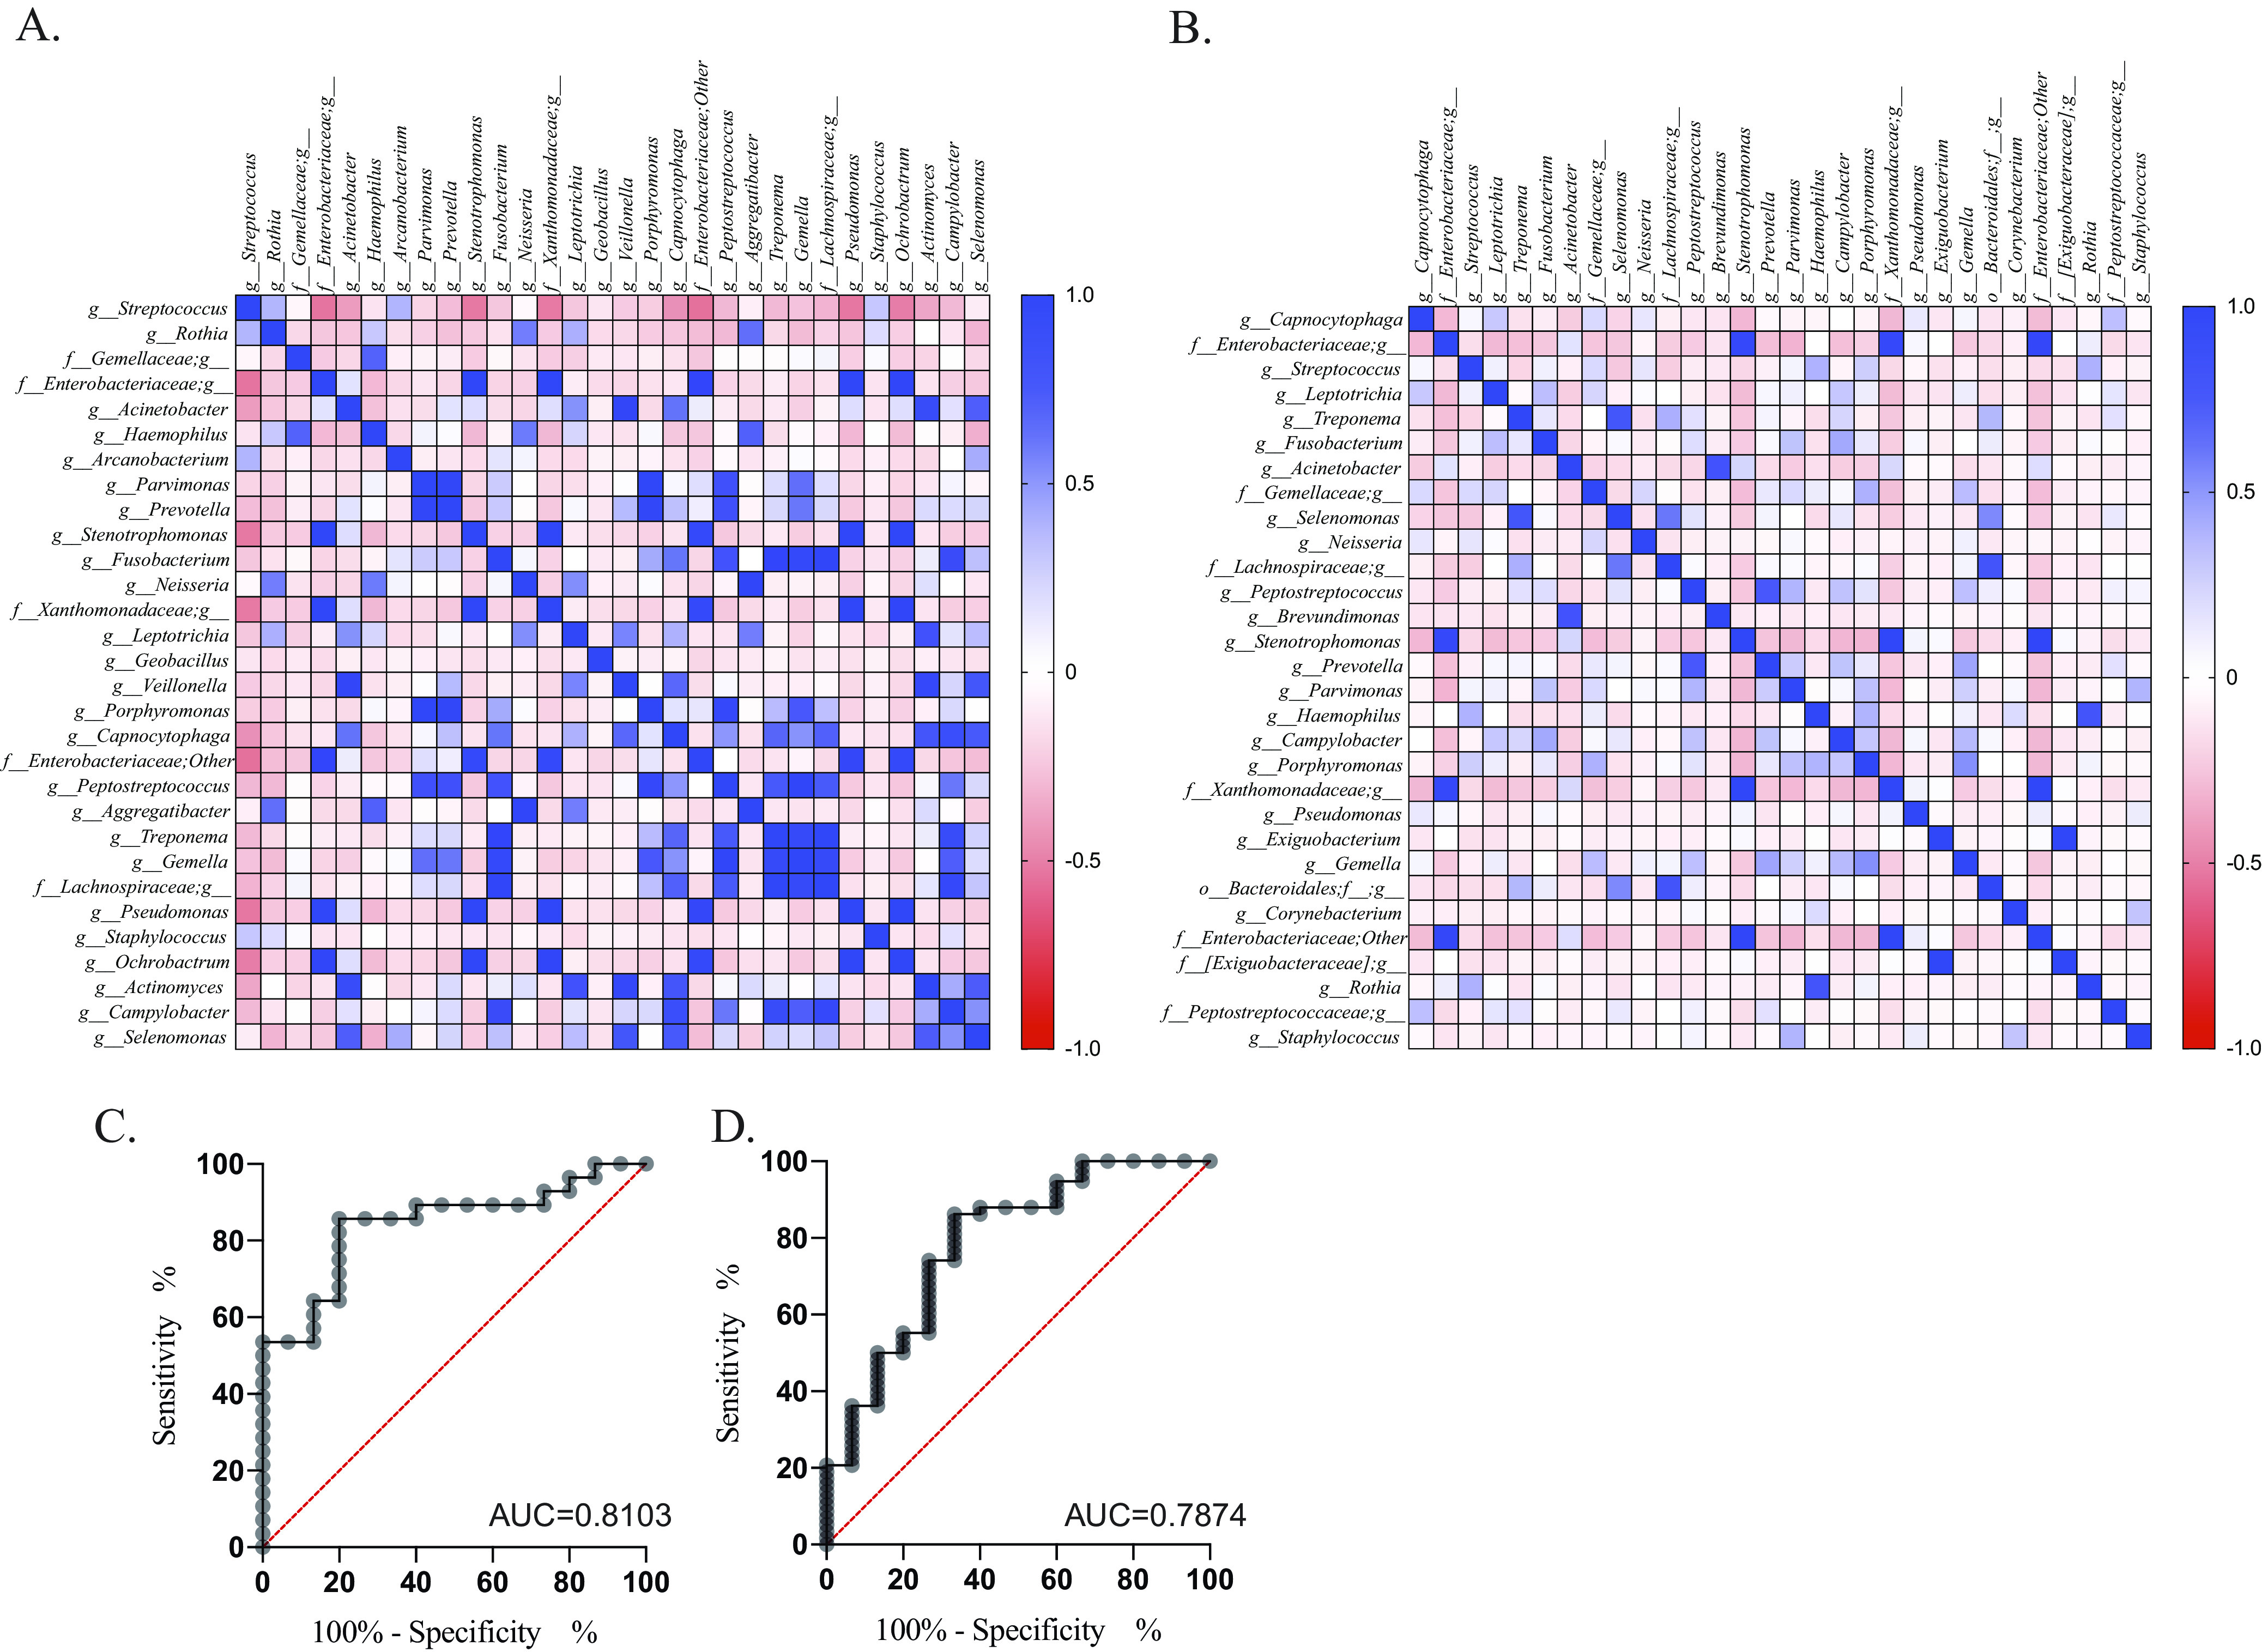
FIG 4.

Co-occurrence and prediction analysis. Co-occurrence analysis of top 30 bacterial genera in precancer (A) and cancer (B) groups with Pearson’s correlation analysis presented through heat map. The color key represents r values. ROC curve for genus Capnocytophaga (C) and Streptococcus (D).
