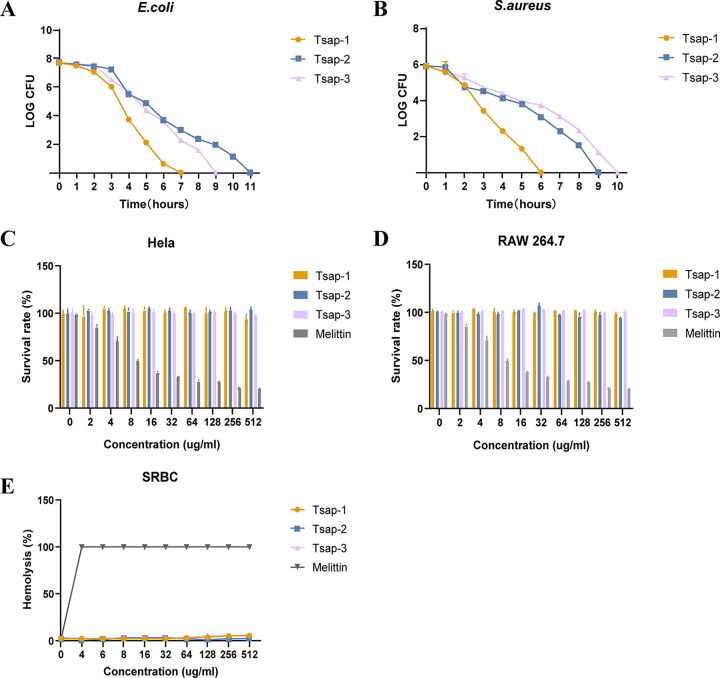
FIG 4.
Hemolytic activity and cytotoxicity. Shown are time-kill curves for Tsap AMPs (1× MBC) in E. coli ATCC 25922 (A) and S. aureus ATCC 25923 (B). Cytotoxicity of AMPs at various concentrations in HeLa cells (C) and RAW 264.7 cells (D) is shown. Notably, 0 μg/mL to 512 μg/mL of melittin were used as a positive control, and the PBS group was used as a negative control. Hemolytic activity toward sheep red blood cells of Tsap peptides at various concentrations are shown (E), and melittin was used as the control.

