FIG 4.
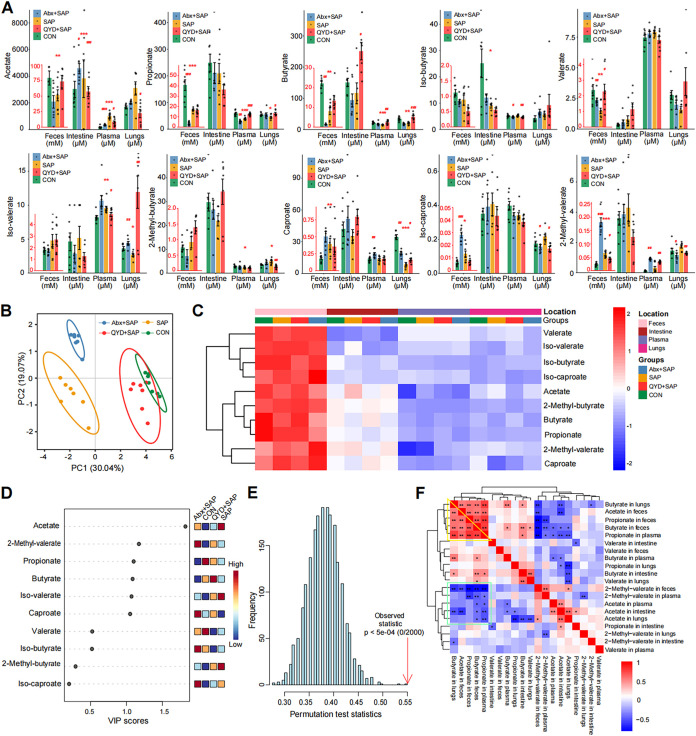
Differences in the concentration of SCFAs in sites related to the gut-lung axis among the groups. (A) The histogram of SCFAs concentrations in plasma, feces, lungs, and intestine. (B) PCA analysis of SCFAs was performed and shown in a circle plot according to a 95% confidence interval (CI). (C) Heatmap of SCFAs in different groups under different sample types. (D) The VIP score calculated by MetaboAnalyst (V5.0) with a score higher than 1 indicates that the SCFA is representative of the subgroup. (E) Construction of the PLS-DA model, and a P < 0.05 indicates an ideal model fit. (F) Correlation heatmap of SCFAs under different sample types and groups was drawn according to the Spearman correlation analysis. Data are shown as mean ± SEM for each group of mice (n = 7 per group) and analyzed by unpaired Student's t test. *, P < 0.05; **, P < 0.01; ***, P < 0.001 in comparison with the CON group and #, P < 0.05; ##, P < 0.01; ###, P < 0.001 in comparison with the SAP group.

