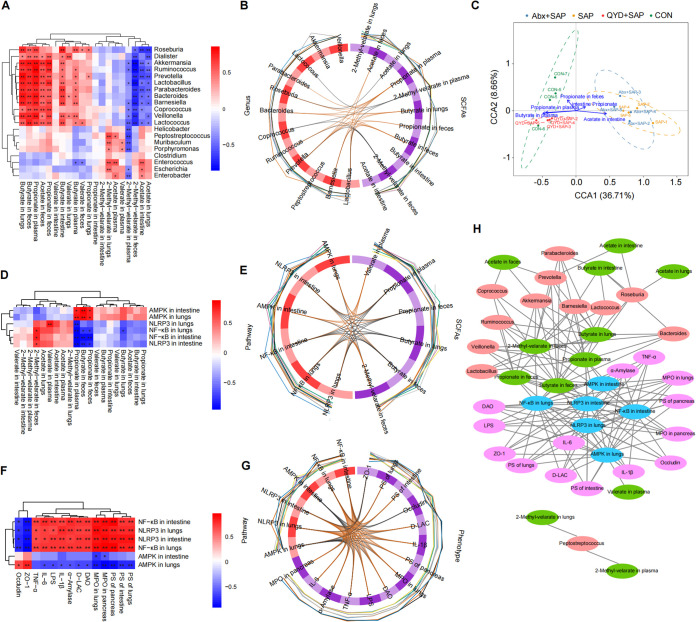
FIG 7.
Correlation analysis between intestinal bacteria, SCFAs, AMPK/NF-κB/NLRP3 pathway, and SAP-ALI phenotype. (A) Heatmap of the correlation between intestinal bacteria and SCFAs based on Spearman correlation analysis. (B) Chord diagram of the correlations between the gut microbiome and SCFAs based on the block.splsda function analysis, the line in the circle represents the correlation coefficient between the bacteria and SCFAs greater or equal to 0.6. (C) CCA analysis. Arrows indicate SCFAs at different sites, dots indicate different samples, and the length of the arrow indicates the degree of correlation between SCFAs and the microbiota in that subgroup. (D) Heatmap of the correlations between SCFAs and the AMPK/NF-κB/NLRP3 pathway. (E) Chord diagram of the correlations between SCFAs and the AMPK/NF-κB/NLRP3 pathway. (F) Heatmap of the correlations between the AMPK/NF-κB/NLRP3 pathway and disease phenotypes of SAP-ALI. (G) Correlation chord diagram of the AMPK/NF-κB/NLRP3 pathway with disease phenotypes of SAP-ALI. (H) Network diagram showing intestinal bacteria, SCFAs, AMPK/NF-κB/NLRP3 pathways, and SAP-ALI disease phenotypes. Connected lines represent correlations greater than 0.6, with P < 0.05. The asterisks in the heatmaps represent significance level. *, P < 0.05; **, P < 0.01.

