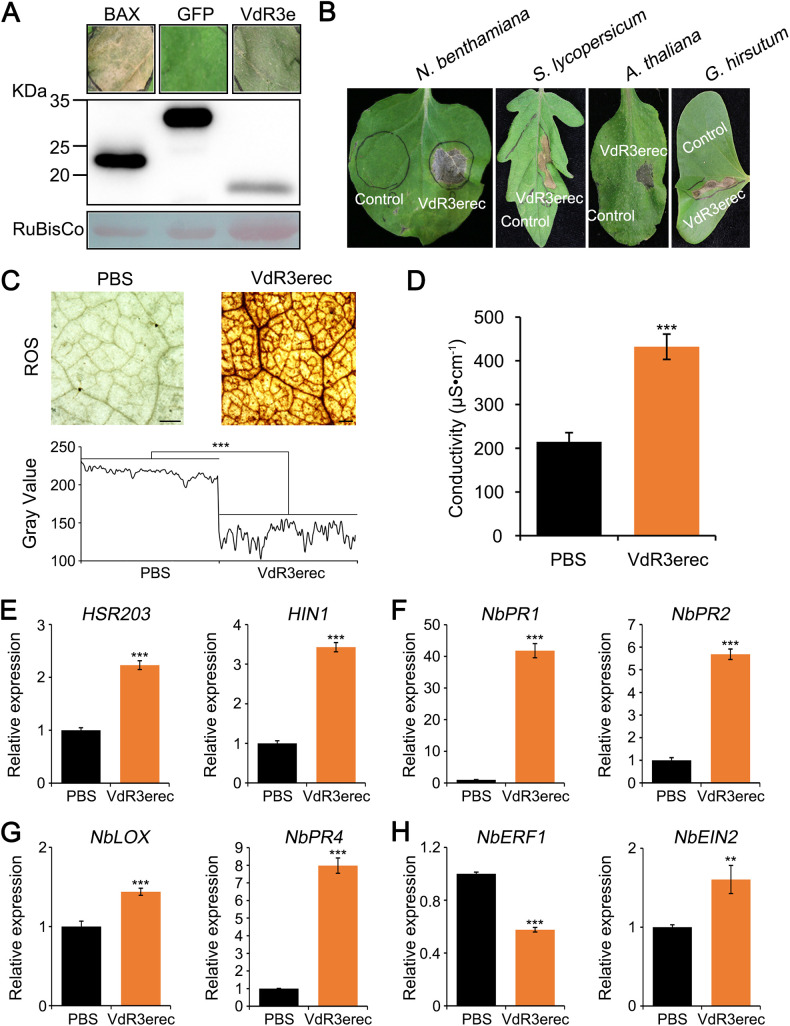
FIG 2.
V. dahliae VdR3e induces cell death and multiple defense responses. (A) Analyses of induced cell death and immunoblotting. A. tumefaciens expressing VdR3e was infiltrated into 4-week-old N. benthamiana leaves to detect its activity in inducing cell death. GFP and BAX (Bcl-2-associated X protein) were used as negative and positive controls, respectively. Four-week-old N. benthamiana leaves were infiltrated with A. tumefaciens expressing target genes and harvested after 2 days. The harvested leaves were used to extract total proteins for Western blot analysis. RuBisCo protein was used as a total protein loading control. (B) Cell death-inducing activities in N. benthamiana, S. lycopersicum, A. thaliana, and G. hirsutum leaves were detected after infiltration with VdR3erec (50 μg/mL) and a PBS control. (C) Detection of ROS accumulation induced by VdR3e. Detection of ROS accumulation levels in N. benthamiana leaves after infiltration with VdR3erec (5 μg/mL) and PBS for 2 days. Scale bars, 500 μm. ImageJ was used to analyze the gray value. Values represent the means ± the standard errors (SE) of three independent samples. Asterisks (*), double asterisks (**), and triple asterisks (***) represent statistical significances at 0.01 < P < 0.05, 0.001 < P < 0.01, and P < 0.001, respectively, based on unpaired Student t tests. (D) Detection of electrolyte leakage induced by VdR3e. The N. benthamiana leaves were infiltrated with VdR3erec (5 μg/mL) and PBS. The leaves were harvested 2 days later to assess electrolyte leakage. Values represent the averages of three independent measurements with three replicates each. Error bars represent the standard errors of the mean. Asterisks (*), double asterisks (**), and triple asterisks (***) represent statistical significance at 0.01 < P < 0.05, 0.001 < P < .01, and P < 0.001, respectively, based on unpaired Student t tests. (E to H) Detection of VdR3e-induced defense response-related gene expression. VdR3erec and a PBS control were infiltrated in N. benthamiana leaves, and the transcription levels of defense-related genes HSR203 (E), H1N1 (E), NbPR1 (F), NbPR2 (F), NbLOX (G), NbPR4 (G), NbERF1 (H), and NbEIN2 (H) were quantified by RT-qPCR 2 days later. Values represent the means ± the SE of three independent samples. Asterisks (*), double asterisks (**), and triple asterisks (***) represent statistical significance at 0.01 < P < 0.05, 0.001 < P < 0.01, and P < 0.001, respectively, based on unpaired Student t tests.

