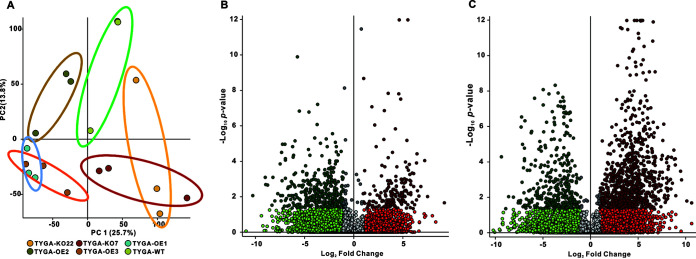
FIG 10.
Comparison of metabolic profiles of fermentation broth from the WT, ΔAfLaeA, and OE strains. (A) PCA of the secondary metabolites produced by WT, ΔAfLaeA, and OE strains cultured in TYGA medium for 14 days. TYGA-WT represents the WT strain. TYGA-KO22 and TYGA-KO7 represent the ΔAfLaeA strains. TYGA-OE1, TYGA-OE2, and TYGA-OE3 represent the OE strains. (B) Volcano plot of differential metabolites in ΔAfLaeA strains compared with the WT strain. The 340 compounds on the left half of the plot were present at significantly higher levels in the WT sample. (C) Volcano plot of differential metabolites in OEAfLaeA strains compared with the WT strain. The 860 compounds on the right half of the plot are present at significantly higher levels in the OE-3 sample.

