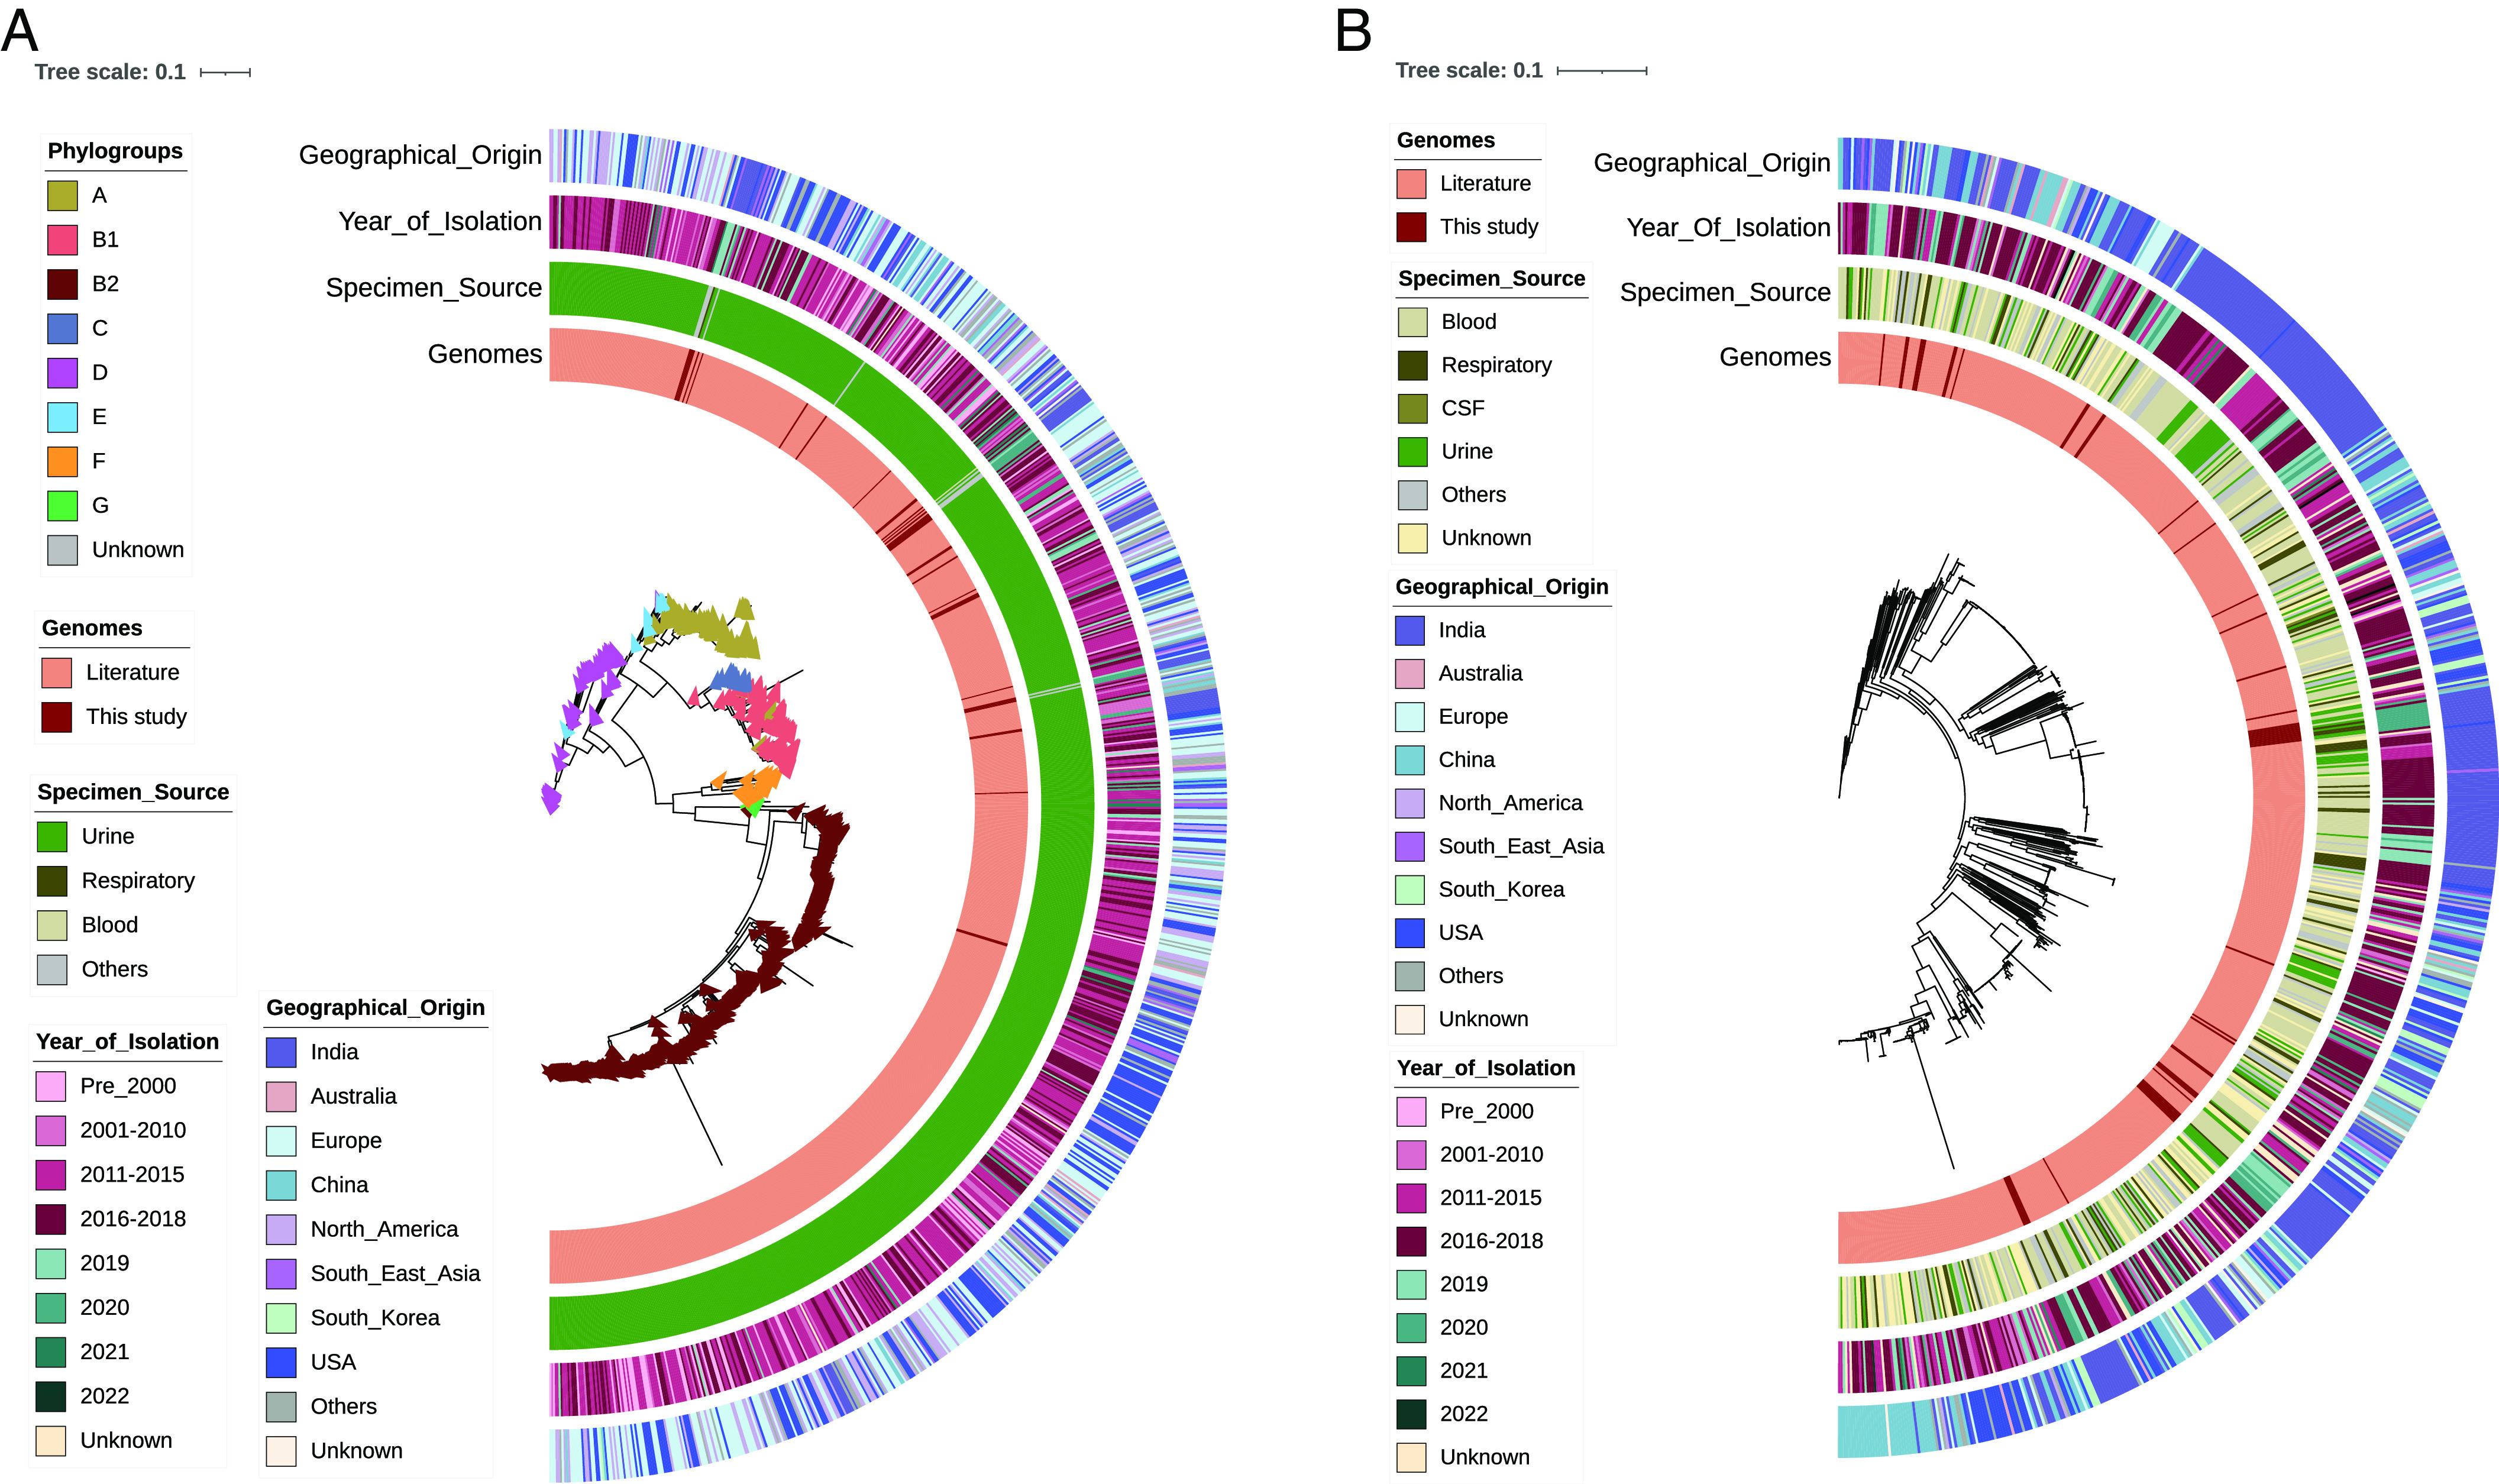
Fig. 3.

Global phylogeographical analysis of (A) E. coli (n = 995) and (B) K. pneumoniae (n = 776) along with their specimen source, geographical origin, and year of isolation. Phylogroups are mentioned for E. coli. The tree scale indicates the number of substitutions per genome per site.
