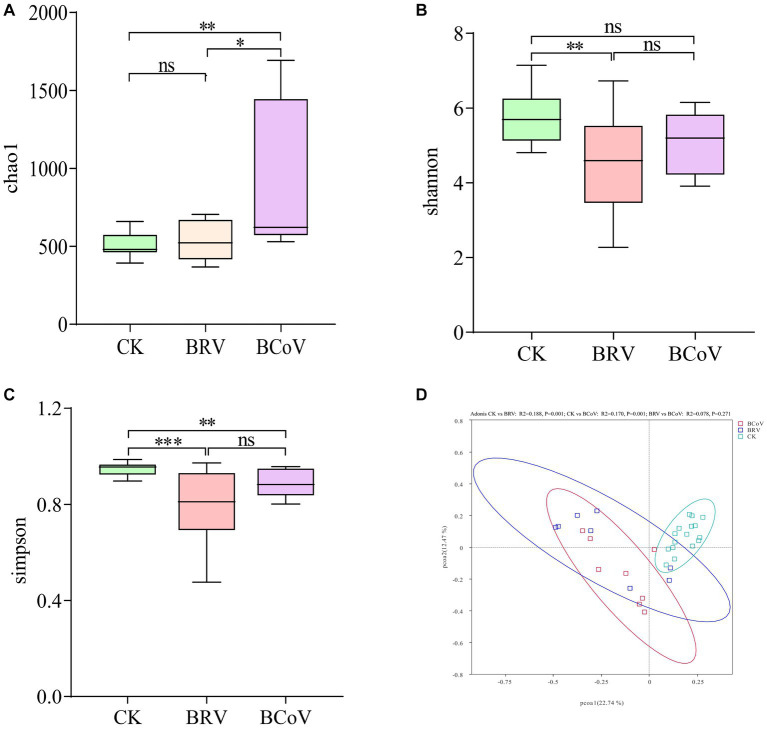
Figure 2.
Calf fecal microbiota diversity. (A) Chao 1 index box plot. (B) Shannon index box plot. (C) Simpson index box plot. (D) PCoA diagram. The top and bottom borders of the box plot represent the maximum and minimum values, and the middle line represents the median. *p < 0.05, **p < 0.01, ***p < 0.001, nsP > 0.05.

