Figure 3.
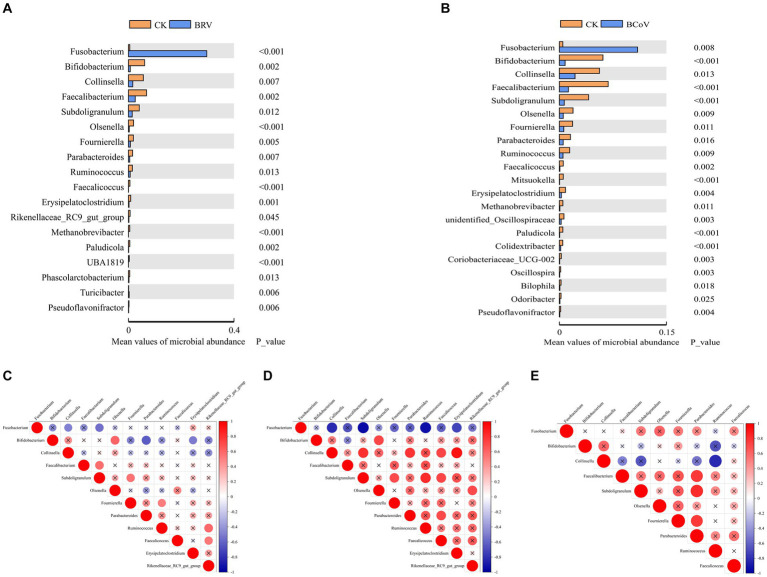
Differential microbiota between groups and correlation analysis. (A)Wilcoxon tests for genus levels in the CK and BRV groups. (B)Wilcoxon tests for genus levels in the CK and BCoV groups. (C) Correlation between different microbiota in the CK group. (D) Correlation between different microbiota in the BRV group. (E) Correlation between different microbiota in the BCoV group. In the correlation map, positive correlations are shown in red, negative correlations in blue, and the size of the circles indicates the correlation coefficient, with larger circles indicating larger values. A p-value > 0.05 is considered insignificant. A cross is added to the circle indicating the correlation coefficient in this case.

