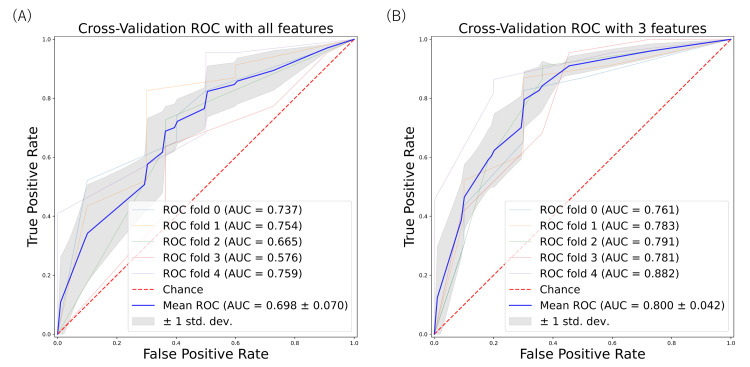
Figure 1. ROC curve for predicting bacterial gastroenterocolitis based on machine learning models.
The area under the ROC curve is calculated by ROC curves using all variables (A) and three variables (PLR, eosinophils, and WBC) (B) based on the decision tree classifier.
ROC: receiver operating characteristics; PLR: platelet-lymphocyte ratio; WBC: white blood cells; ROC: receiver operating characteristics; AUC: area under ROC curves.

