
Figure 2:
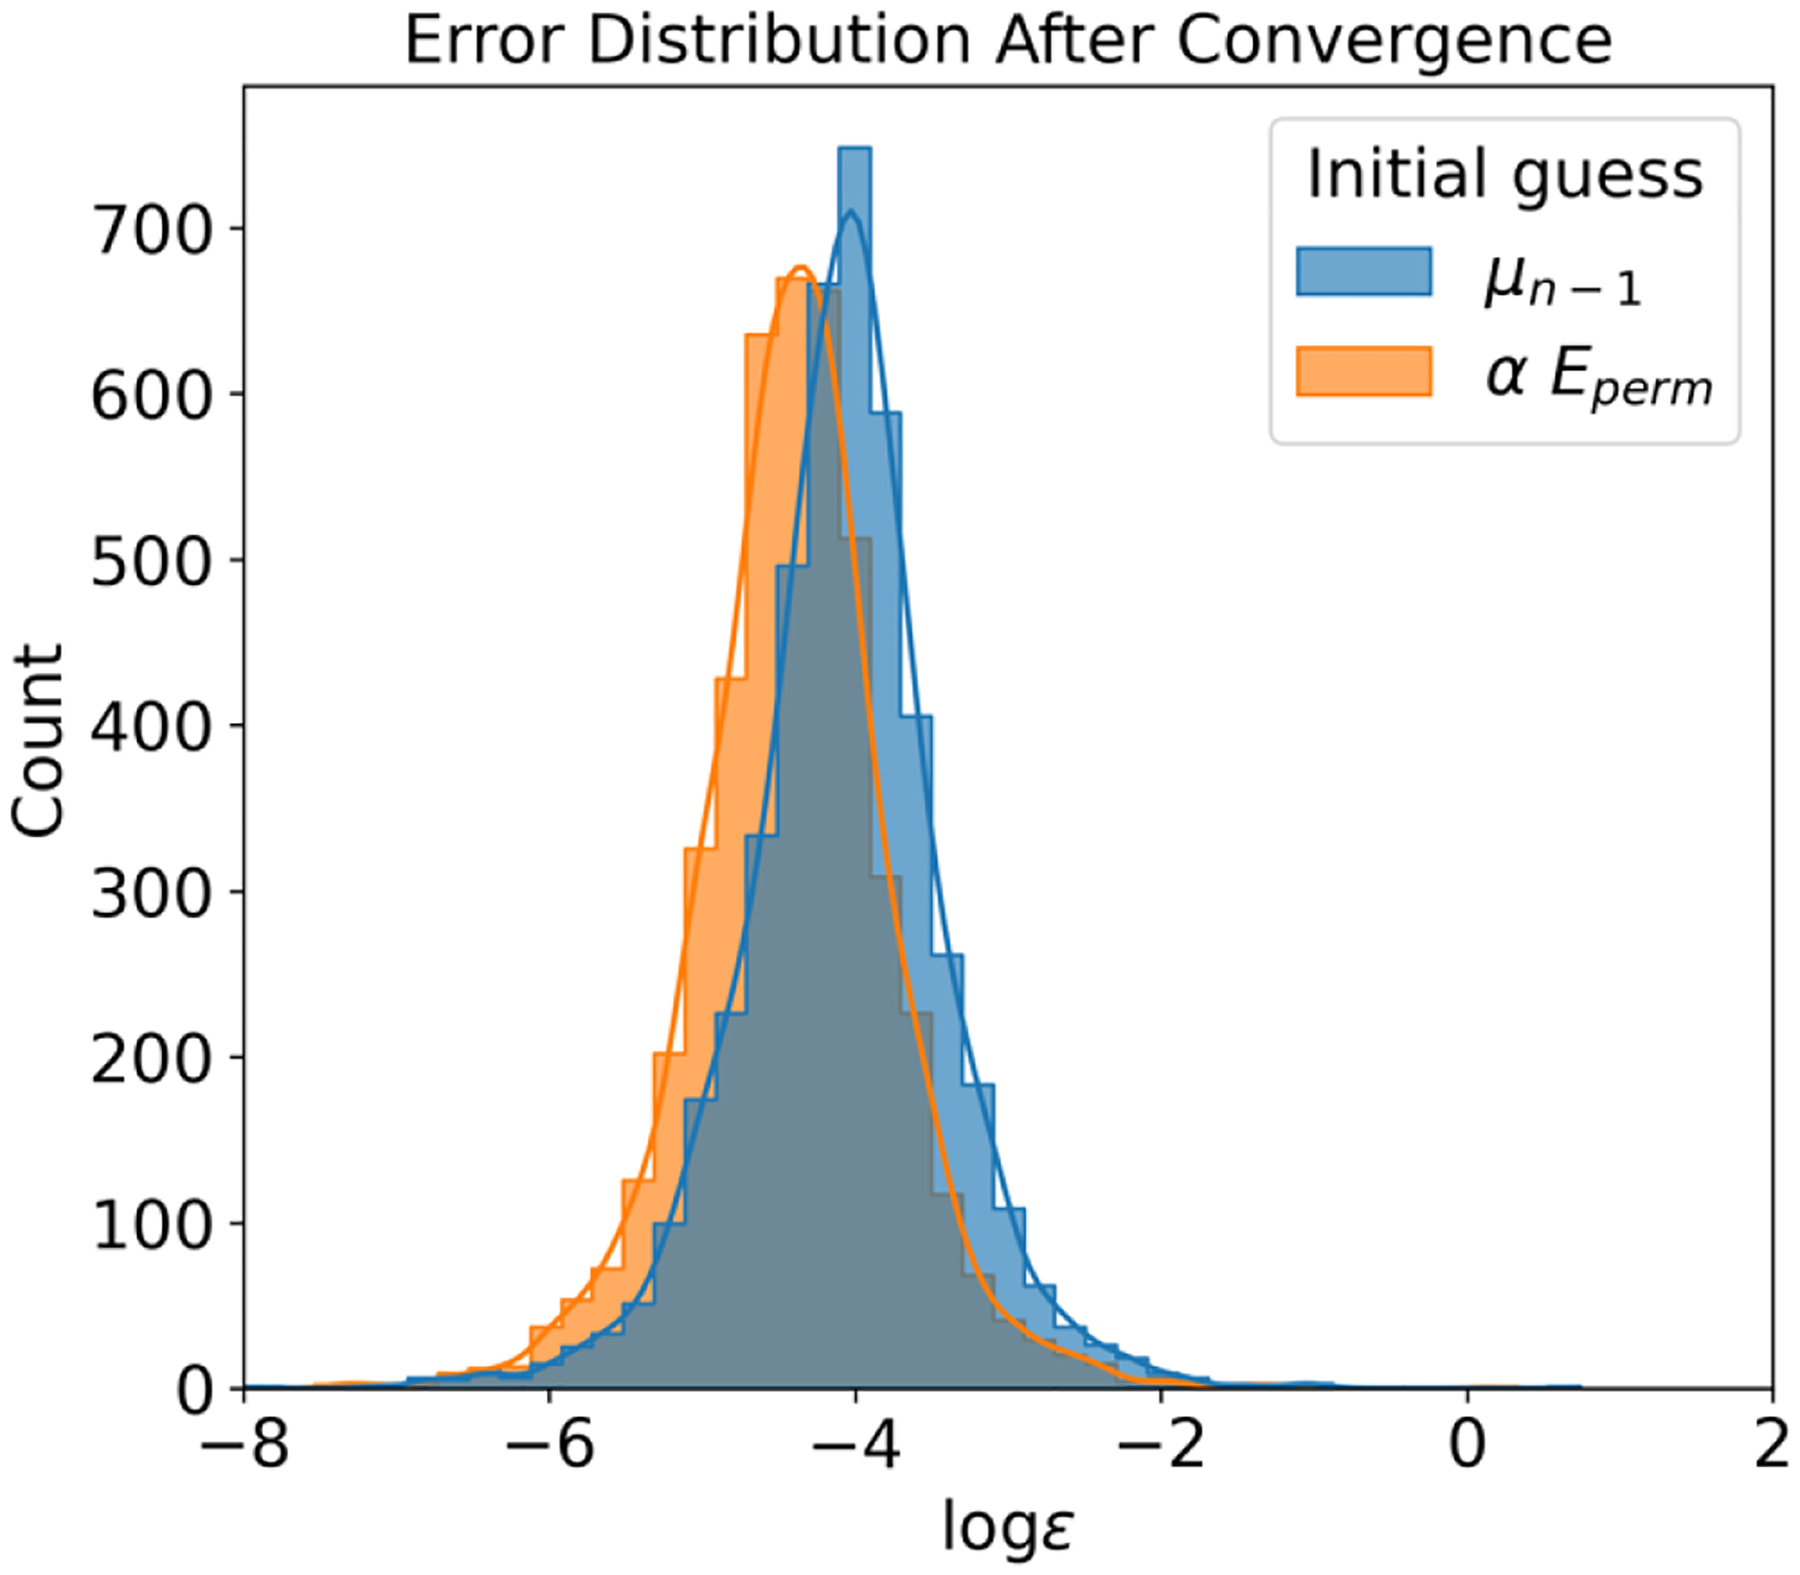
Post-convergence Error Distribution Comparison with and without the Use of Historical Data. This figure presents the error distribution after achieving convergence when employing historical data compared to not using it. It illustrates that the use of historical data results in larger errors compared to using the permanent field as the initial guess. The convergence tolerance for this analysis is set at 10−4.