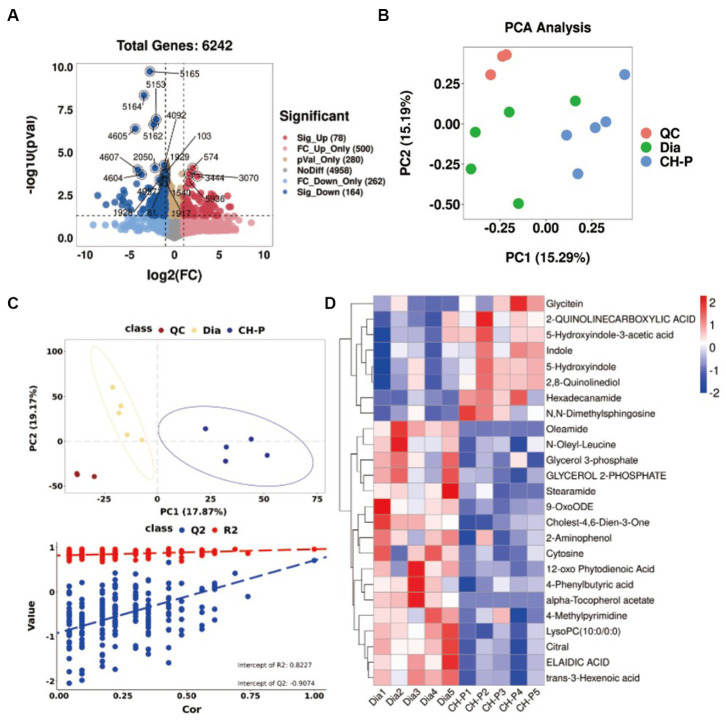
Figure 6.
Untargeted metabolomics analysis of the metabolites in the diabetic and CH-P treatment groups using the POS model. (A) Principal component analysis score plot showing comparisons of the metabolomic profiles in both groups. (B) Volcano plot showing the differentially accumulated and significantly changed metabolites. (C) The PLS-DA score plot comparing the metabolome profiles in both groups and statistical validation of the PLS-DA model by permutation testing. (D) Hierarchical clustering heatmap of metabolites showing metabolites that significantly differ in abundance between both groups.

