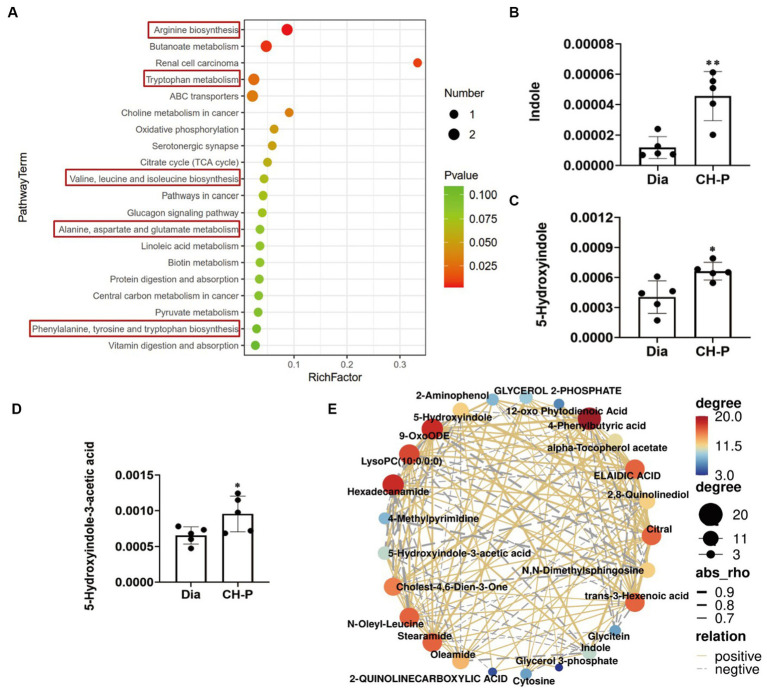
Figure 7.
Metabolic pathways involving the differential metabolites and their correlation. (A) Pathway enrichment analysis of the differential metabolites. (B) Comparison of the relative abundance of indole in diabetic and CH-P treatment groups. (C) Comparison of the relative abundance of 5-hydroxyindole in diabetic and CH-P treatment groups. (D) Comparison of the relative abundance of 5-hydroxyindole-3-acetic acid in diabetic and CH-P treatment groups. (E) Correlation analysis of the differential metabolites using the POS model. *p < 0.05, vs. Dia; **p < 0.01, vs. Dia.

