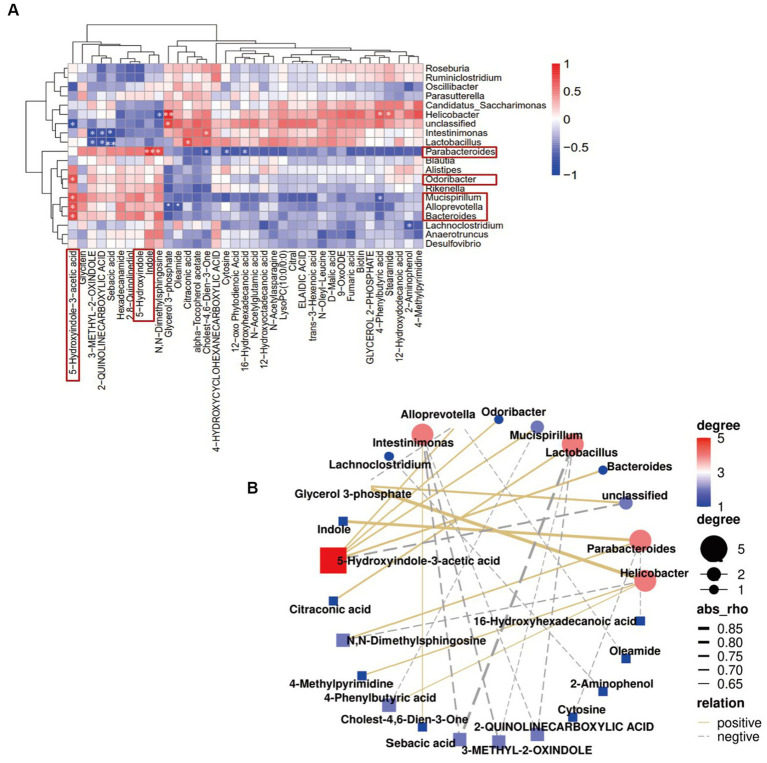
Figure 8.
Correlation analysis of dominant gut microbiota genera with the differential metabolites. (A) Hierarchical clustering heatmap showing the correlation between dominant gut microbiota genera and the differential metabolites. The color intensity shows the degree of correlation (red and blue represents a positive and negative correlation, respectively). *p < 0.05 and **p < 0.01 indicated significant correlations. (B) Network map illustrating interactions among the dominant gut microbiota genera and the differential metabolites.

