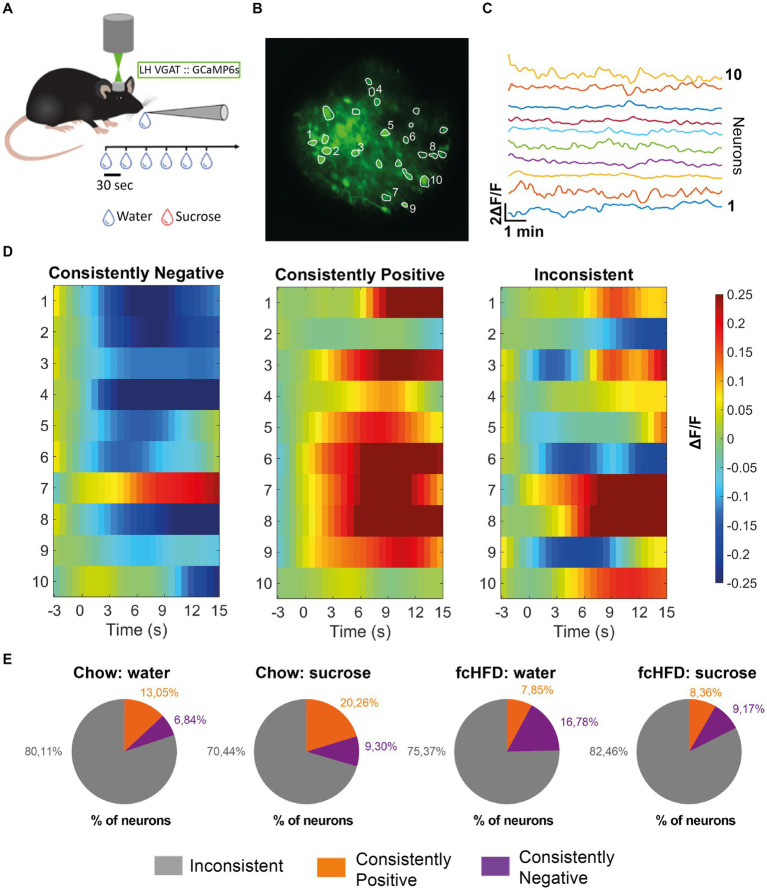
Figure 1.
The majority of individual LHVgat neurons show inconsistent responding to water and sucrose drinking, both during chow and fcHFD feeding. (A) Schematic of experimental design, per imaging day there was a maximum of 60 trials, with 3 recording days per stimulus (water/sucrose). (B) Mean intensity map of an example field of view during imaging all included ROIs outlined, numbers indicate the 10 neurons plotted in (C). (C) Extracted individual calcium (ΔF/F) traces per neuron showed in (B). (D) Example heatmaps of individual neurons (over 10 trials) showing a neuron labeled as a “consistently negative” responder (left), a “consistently positive” responder (middle) and an “inconsistent” responder (right). Consistently responding was considered more than half of the trials a significant response (average ΔF/F > 0.05 or <−0.05). (E) Percentages of labeled neurons per diet group (chow/fcHFD) and consumed drink (water/sucrose). During chow feeding, the number of neurons showing a consistently positive response were increased upon sugar drinking compared to water (χ2 4.29, p: 0.03*). During fcHFD feeding, number of consistently negative responding neurons lowered upon sugar drinking compared to water (χ2 5.81, p: 0.02*).

