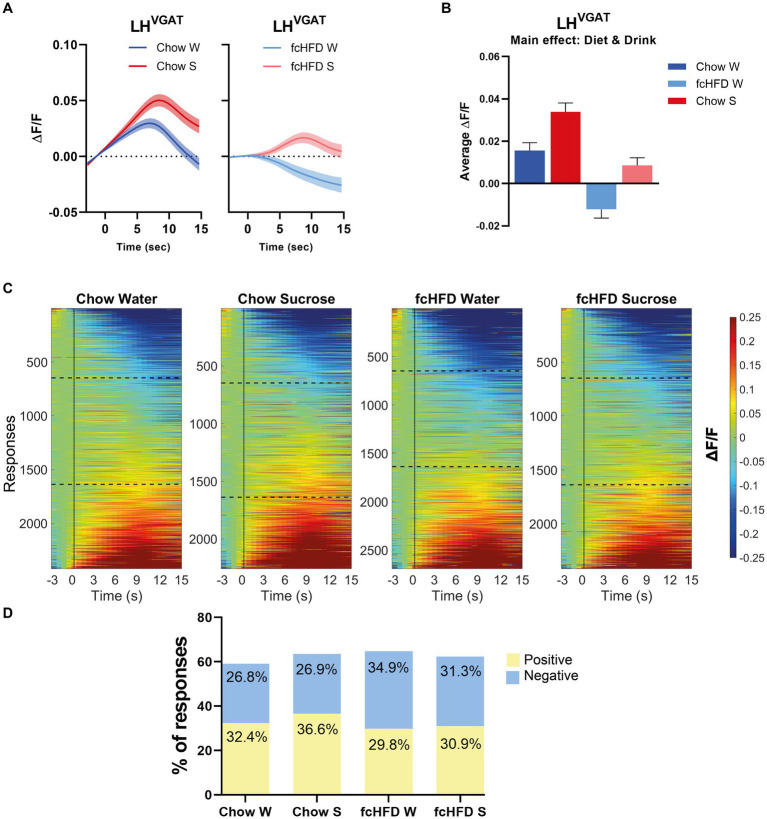
Figure 2.
The network of LHVgat neurons responds increased to sucrose compared to water, and is dampened by fcHFD-feeding. (A) Average ΔF/F of all measured responses over time (i.e., 10 trials per day, 3 days per stimulus) after solution delivery at t = 0 for chow-fed (left) and fcHFD-fed (right) animals. (B) Grand average of all measurements after delivery of water (W) or sucrose (S) on both diets. (C) Heatmaps showing ΔF/F for all the individuals responses, with delivery at t = 0 (dotted line). The horizontal dotted lines represent the boundary of categorizing a response as “negative” or “positive” at an average change in ΔF/F of 0.05. (D) Percentage of positive, negative and no responses (as defined by threshold of ±0.05 ΔF/F) per diet and consumed drink. When chow fed, sucrose drinking significantly decreased the proportion of positive responses compared to water (χ2 9.25, p: 0.002*), whereas during fcHFD feeding, sucrose drinking significantly decreased the proportion of negative responses (χ2 7.18, p: 0.007*). Data displayed as mean ± SEM. *p < 0.05 as tested with a mixed effects model (B) or with a chi-square test (D).

