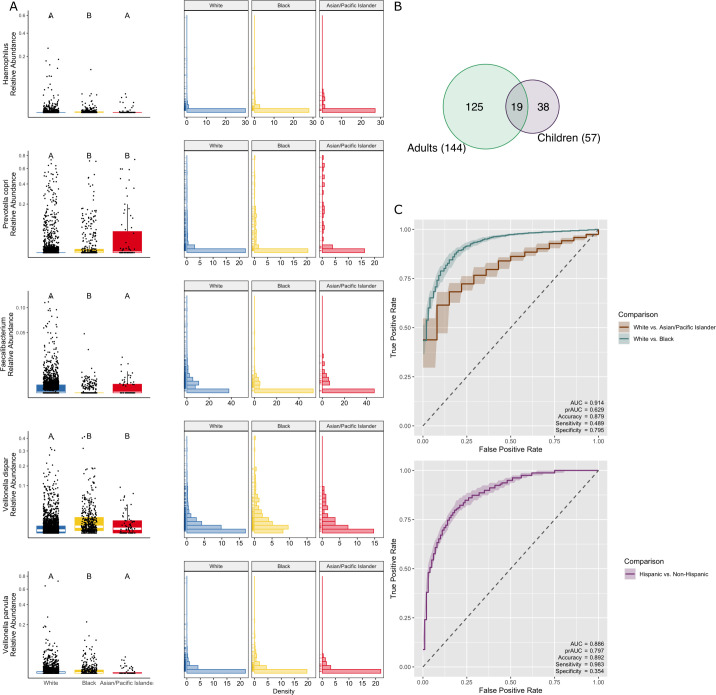
Fig 3. Child gut microbiome variation recapitulates that of adults.
(A) Boxplots showing the relative abundance of select taxa identified as differentially abundant using ANCOM in the current study that overlap with taxa identified as differentially abundant in adults [3]. All boxplots show the median and interquartile range (IQR), and whiskers extend to 1.5*IQR. Relative abundances for boxplots and histograms are square root transformed. (B) Venn diagram showing overlapping taxa that are differentially abundant in the gut microbiome between Black individuals and White individuals in the present study in children and in previously published work in adults. (C) Receiver operating characteristic (ROC) curves for a random forest model classifying race and ethnicity metadata based on the gut microbiome. Shading represents a 50% confidence interval around the median. Overall model accuracy for race and ethnicity was >87% (the percentage of samples correctly classified as Asian/Pacific Islander, Black, or White and Hispanic and non-Hispanic). Data underlying this figure can be found in S5, S6, and S7 Data and S9 Table.

