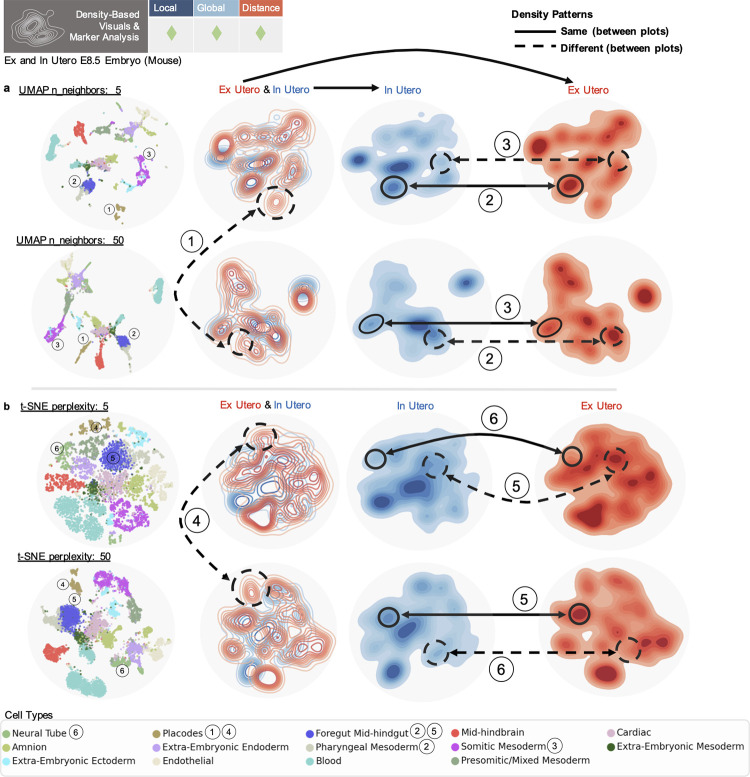
Fig 5. Distortion in density-based visuals and analysis.
(a) Top row (left to right) displays UMAP embedding with n_neighbors = 5, embedding contour plot colored by condition, same contour with just in utero cells, same contour with just ex utero cells. Bottom row shows same plots for UMAP embedding with n_neighbors = 50. (b) Top row shows same plots for t-SNE embedding with perplexity of 5. Bottom row shows same plots for t-SNE embedding with perplexity of 50. Numbers denote comparisons between plots, dashed lines denote a difference, and solid lines denote the same appearance.

