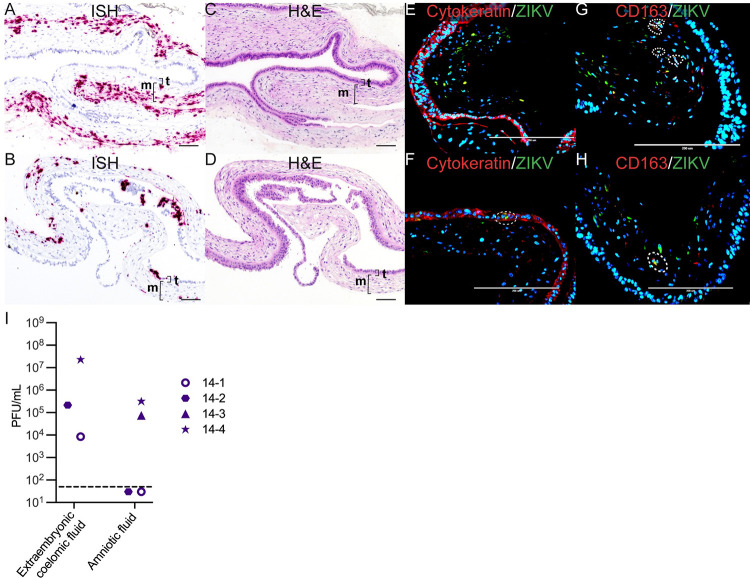
Fig 6. ZIKV infection in the chorionic membrane and extraembryonic coelomic and amniotic fluid at 14 dpi.
(A)(C)(E)(G) Images from 14–3 chorionic membrane. (B)(D)(F)(H) Images from 14–4 chorionic membrane. (A)(B) Pink staining showing ZIKV detected via ISH predominantly within the mesenchymal layer of the chorionic membrane. (C) Corresponding H&E stain of (A). (D) Corresponding H&E stain of (B). The mesenchymal layer is indicated by m and the trophoblast layer is indicated by t. (E)(F) IF staining for cytokeratin (red) and ZIKV (green), and DAPI nuclear stain (blue). (F) The dashed circle indicates the area of colocalization showing ZIKV infection in the trophoblasts of the chorionic membrane. (G)(H) IF staining with CD163 (red), ZIKV (green), and DAPI nuclear staining (blue). The dashed circles indicate areas of colocalization showing ZIKV infection in macrophages. (A)–(D)The scale bar represents 100 μm, (E)–(H) 200 μm. (I) Infectious virus detected by plaque assay. The LOD of 50 plaque-forming units (PFUs) is represented by the dashed line.

