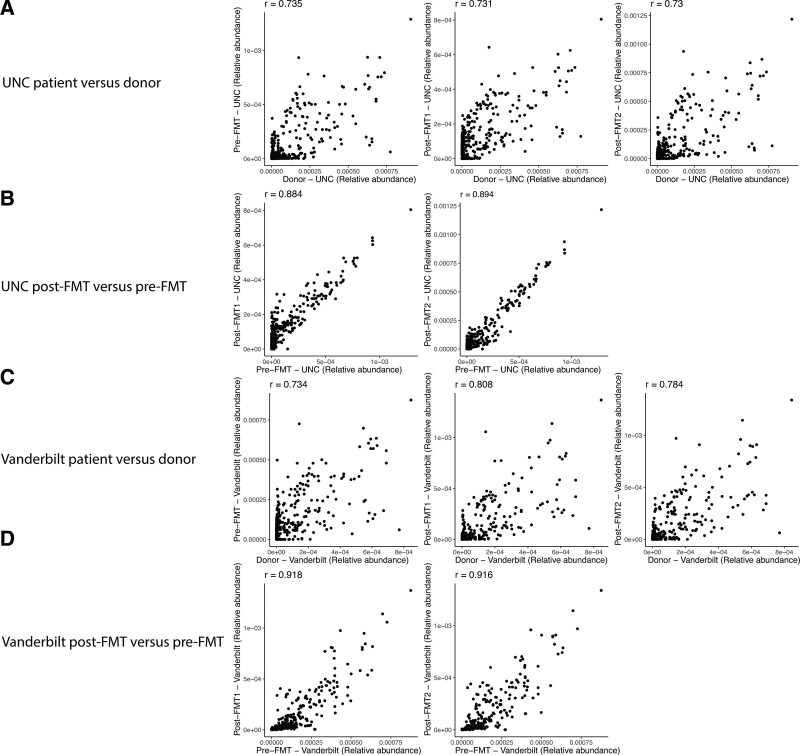
FIGURE 2.
Scatter plots showing the relative abundances of metabolic pathways in patients versus donors and pre-FMT versus post-FMT samples from the UNC and VUMC patients. The Spearman’s rank correlation coefficient is shown for each scatter plot. FMT = fecal microbiota transplantation; VUMC = Vanderbilt University Medical Center.

