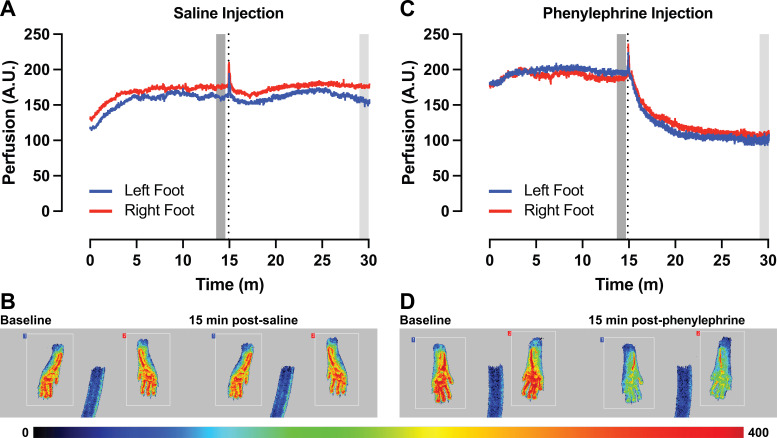
Figure 2.
Use of laser speckle contrast analysis (LASCA) for measurement of blood perfusion and vasoreactivity. A: representative trace of blood perfusion in arbitrary units (AU) before and after intraperitoneal injection of saline (vertical dotted line). B: representative images of perfusion before (left) and 15 min after (right) intraperitoneal injection of saline. C: representative trace of blood perfusion before and after intraperitoneal injection of phenylephrine (PE, vertical dotted line). D: representative images of perfusion before (left) and 15 min after (right) intraperitoneal injection of PE. Pseudo-colored scale bar represents level of perfusion with higher values in red and lower values in blue. Blue lines denote left foot, and red lines denote the right foot, which correspond to the feet and regions of interest in the representative images. Dark gray bar denotes region selected for average baseline perfusion (Bavg). Light gray bar denotes region selected for average perfusion response 15 min postinjection (Ravg).

