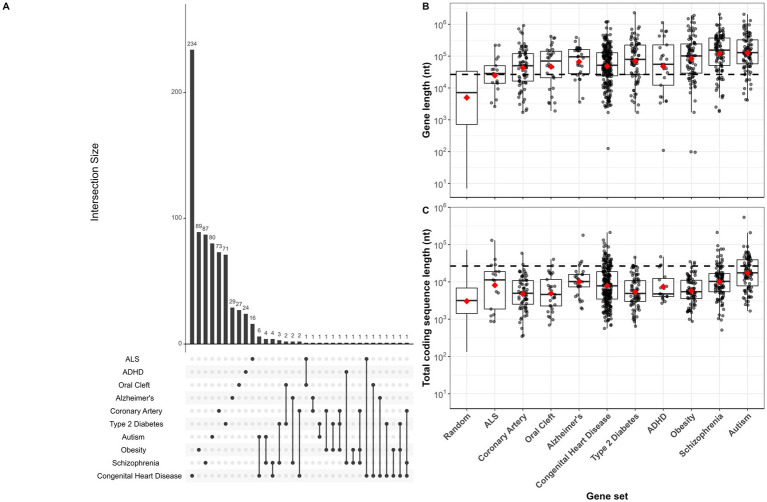
Figure 1.
(A) Gene set intersection plot. Horizontal bars depict gene set sizes. Gene sets included in each intersection are indicated by a single or connected dot(s), and sizes of the intersections are indicated by vertical bars. For single, unconnected dots, vertical bars indicate the number of genes exclusive to that set. For example, among 253 Congenital Heart Disease genes, 6 overlapped with Autism genes, while 234 had no overlap with other gene sets. Intersections with zero overlap not shown. (B,C) Sequence length boxplots with median and 1.5 interquartile range (IQR) whiskers shown for each disease implicated gene set for entire genes (B) and coding sequence (C). Red diamonds indicate mean sequence length for each set indicated on x-axis, and dashed black line across entire plot indicates mean gene length of randomly mutated genes (modeled by randomly sampling (i.e., mutating) 100,000 nucleotides from all genes or all CDS in the human genome). Gene and CDS boxplots also shown for all 300,000 randomly sampled sequences (1,000 sets of 300 genes or CDS).

