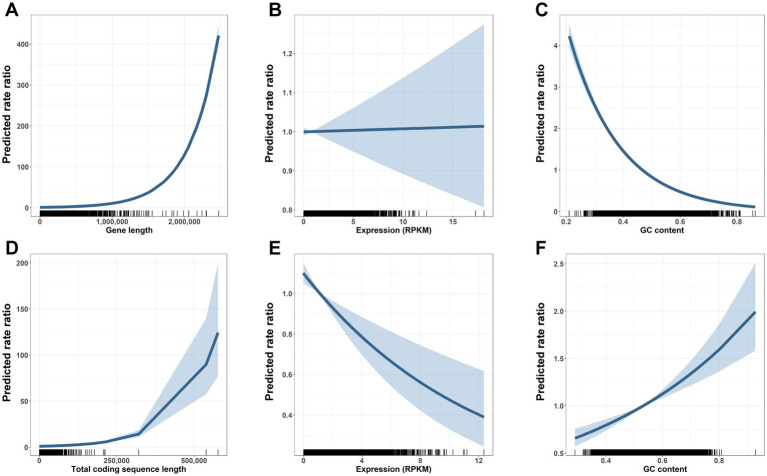
Figure 4.
Gene length and other determinants of mutation vulnerability across gene bodies and coding sequences. Gene body Quasi-Poisson model results (A–C) depict centered rate ratios (lines) and 95% confidence intervals (shaded regions) at each value of x (i.e., panel A shows the predicted mutation rate ratio of a gene with gene length indicated on the x-axis versus a gene with length, expression, and GC content set to the mean). Distribution of gene characteristics shown along the x axis, with one mark per observation. Longer gene length is associated with higher mutation frequencies across carcinogen treated cells (A). Expression is not associated with altered mutation risk across gene bodies (B). Higher GC content is associated with decreased mutation risk across gene bodies (C). Coding sequence (CDS) Quasi-Poisson model results (D–F) depict centered rate ratios (lines) and 95% confidence intervals (shaded regions) at each value of x. Distribution of CDS characteristics shown along the x axis, with one mark per observation. Longer coding sequence is associated with a modestly increased risk of mutation (D). Higher gene expression is associated with reduced CDS mutations (E). In contrast to the gene body, higher GC content is associated with increased risk of CDS mutation (F).

