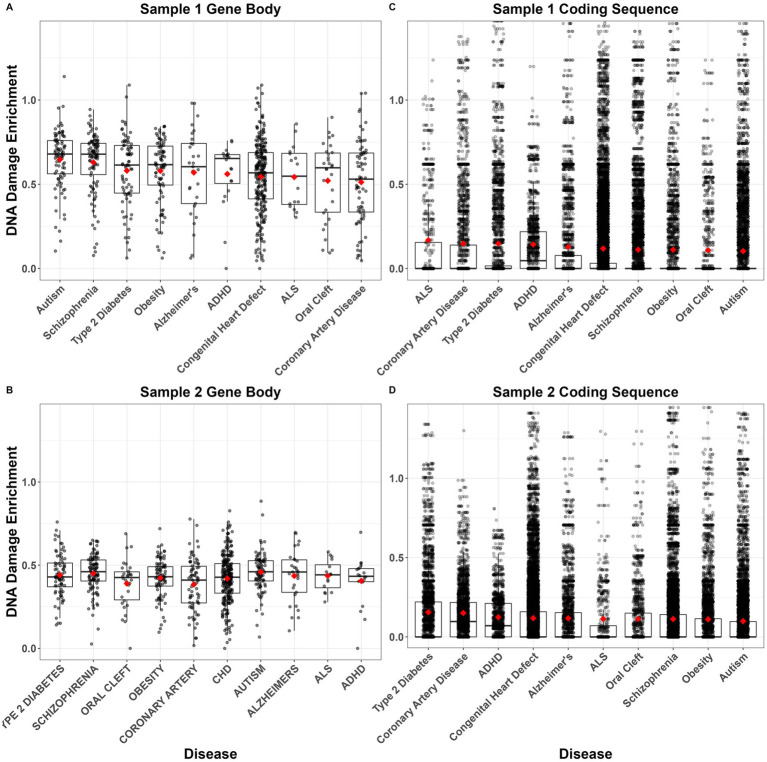
Figure 8.
Average DNA damage enrichment following polycyclic aromatic hydrocarbon (PAH) treatment of GM12878 cells across each gene body (A,B) or coding sequence (C,D) in each of 10 disease-related gene sets. Enrichment values indicate the number of tXR-seq counts per gene/coding sequence, controlling for sequence length. Boxplots show median and interquartile range (IQR) with 1.5 IQR whiskers. Gene sets are ordered left–right within each panel from highest to lowest mean enrichment (red diamonds). Data come from two samples of treated cells from Li et al. (2017).

