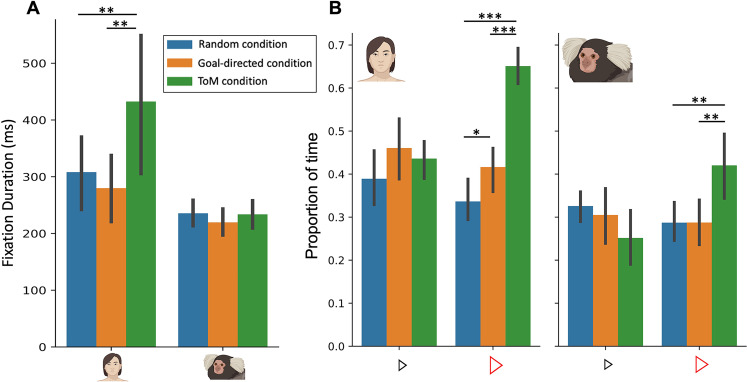
Figure 2. Fixation duration (A) and proportion of time looking triangles (B) in Frith-Happé’s ToM, GD and Random animations in humans (left) and marmosets (right).
(A). Bar plot depicting the fixation duration in the screen as a function of each condition. (B). Bar plot representing the proportion of time the radial distance between the current gaze position and each triangle was within 4 visual degrees, as a function of each condition. Green represents results obtained for ToM animation videos, orange represents results for GD animation videos and blue represents results for Random animation videos. In each graph, the left panel shows the results for 11 humans and the right panel for 11 marmosets. Each colored bar represents the group mean and the vertical bars represent the standard error from the mean. The differences between conditions were tested using ANOVA: p<0.05*, p<0.01** and p<0.001***.

