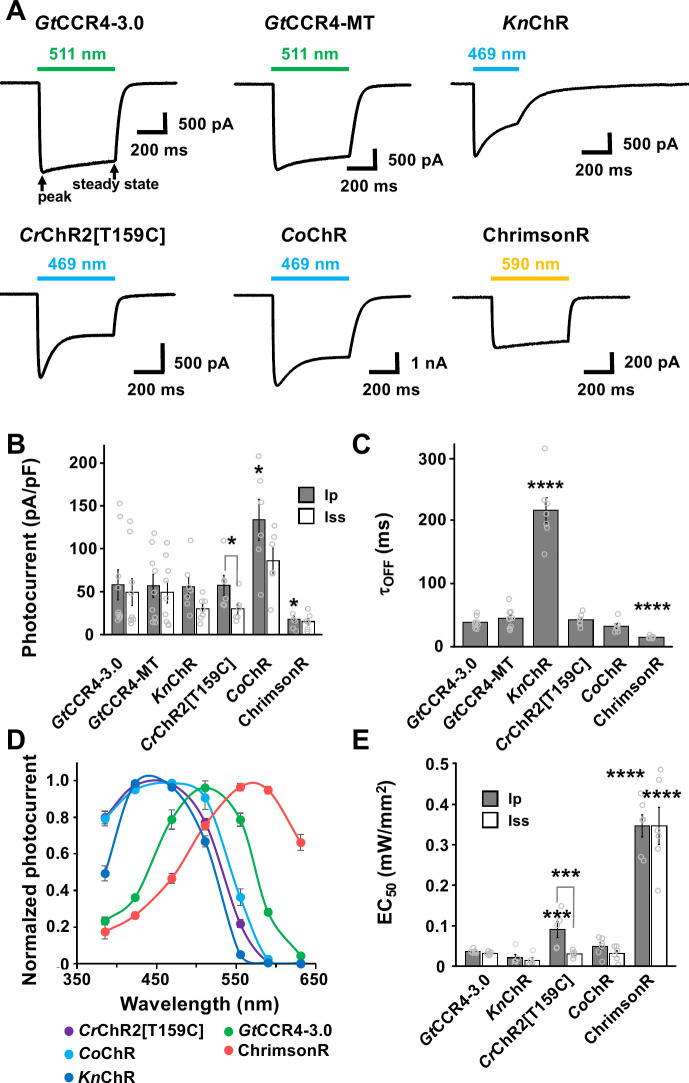
Figure 1. Photocurrent properties of channelrhodopsins.
(A) Representative photocurrent traces of GtCCR4-3.0-EYFP (GtCCR4-3.0), GtCCR4-MT-P2A-TagCFP (GtCCR4-MT), KnChR, CrChR2[T159C], CoChR, and ChrimsonR. Electrophysiological recordings were performed. Membrane voltage was clamped at –60 mV. Illumination sources were 511 nm light (GtCCR4-3.0, GtCCR4-MT), 469 nm light (KnChR, CrChR2[T159C], CoChR), and 590 nm light (ChrimsonR) at 1.4 mW/mm2. (B) Photocurrent amplitude. Gray bar: peak photocurrent (Ip); white bar: steady state photocurrent (Iss) (n = 6–9). Wilcoxon rank-sum test (CrChR2[T159C]-mCherry Ip vs. Iss, p=0.025; CoChR-tdTomato Ip vs. GtCCR4-3.0-EYFP Ip, p=0.025; ChrimsonR Ip vs. GtCCR4-3.0-EYFP Ip, p=0.049). (C) Comparison of the channel closing kinetics after shutting-off light (τoff) (n = 6–9), Wilcoxon rank-sum test (KnChR-EYFP vs. GtCCR4-3.0-EYFP, p=0.0002; ChrimsonR vs. GtCCR4-3.0-EYFP, p=0.0004). (D) The action spectrum of GtCCR4-3.0 (green circle), KnChR (blue circle), CrChR2[T159C] (purple circle), CoChR (light blue circle), and ChrimsonR (red circle). Illumination sources were 385, 423, 469, 511, 555, 590, or 631 nm light at 1.4 mW/mm2 (GtCCR4-3.0, CrChR2[T159C]) or 0.14 mW/mm2 (KnChR, CoChR, ChrimsonR) (n = 5–10). (E) Half saturation maximum (EC50) of the peak photocurrent (gray bar) and the steady-state photocurrent (white bar) are shown (n = 5, 6), Wilcoxon rank-sum test (CrChR2[T159C]-mcherry Ip vs. Iss, p=0.0079; CrChR2[T159C]-mCherry Ip vs. GtCCR4-3.0-EYFP Ip, p=0.0086; ChrimsonR Ip vs. GtCCR4-3.0-EYFP Ip, p=0.0021; ChrimsonR Iss vs. GtCCR4-3.0-EYFP Iss, p=0.0021). *p<0.05, **p<0.01, ***p<0.001, ****p<0.0005, Mean and SEM are indicated.


