. 2023 Aug 17;12:e83975. doi: 10.7554/eLife.83975

Figure 3. Optogenetic activation of hindbrain reticulospinal V2a neurons by GtCCR4, KnChR, and CrChR2[T159C].

(A) Light stimulation-dependent locomotion rates of 3-dpf Tg larvae expressing GtCCR4-3.0-EYFP, GtCCR4-MT, KnChR-3.0-EYFP, CrChR2[T159C]-mCherry. The hindbrain area was irradiated with light (0.4 mW/mm2) with a wavelength of 520 nm (GtCCR4-3.0-EYFP and GtCCR4-MT) or 470 nm (KnChR-3.0-EYFP and CrChR2[T159C]-mCherry) for 100 ms. Six consecutive stimulation trials were analyzed for eight rhodopsin-expressing and non-expressing (control) larvae of each Tg line. The average locomotion rates for each larva are shown, Wilcoxon rank-sum test (GtCCR4-3.0-EYFP vs. control, p=0.00166; GtCCR4-MT vs. control, p=0.00216; KnChR-EYFP vs. control, p=0.000266; CrChR2[T159C]-mCherry vs. control, p=0.0246). (B–D) Latency (B), duration (C), and strength (D) of tail movements. The time from the start of light stimulation to the first tail movement was defined as latency (s), and the time from the start of the first tail movement to the end of that movement was defined as duration (s). The maximum distance that the caudal fin moved from the midline divided by body length was measured as representative of its strength. One-way ANOVA with Tukey’s post hoc test (latency GtCCR4-3.0-EYFP vs. CrChR2[T159C]-mCherry, p=0.0115; GtCCR4-3.0-EYFP vs. KnChR-EYFP, p=0.0128; strength GtCCR4-3.0-EYFP vs. KnChR-EYFP, p=0.00601; GtCCR4-MT vs. KnChR-EYFP, p=0.00181; KnChR-EYFP vs. CrChR2[T159C]-mCherry, p=4.00e-06). (E) Locomotion evoked by light of various light intensities. The hindbrain area was irradiated with light at 0.4, 0.2, or 0.1 mW/mm2. Six consecutive trials were analyzed for 4–6 rhodopsin-expressing larvae for each Tg (n = 6 for GtCCR4-3.0-EYFP and KnChR-3.0-EFYP; n = 5 for CrChR2[T159C]-mCherry). Light stimulation experiments at 0.2 and 0.1 mW/mm2 were conducted only on larvae that exhibited evoked locomotion three or more times in response to the initial light stimulation at 0.4 mW/mm2. One-way ANOVA with Tukey’s post hoc test (GtCCR4-3.0-EYFP: 0.4 mW/mm2 vs. 0.1 mW/mm2, p=1.03e-05, 0.4 mW/mm2 vs. 0.2 mW/mm2, p=4.39e-05; CrChR2[T159C]-mCherry: 0.4 mW/mm2 vs. 0.1 mW/mm2, p=0.0185). *p<0.05, **p<0.01, ***p<0.001, ns: not significant. Means and SEMs are indicated.

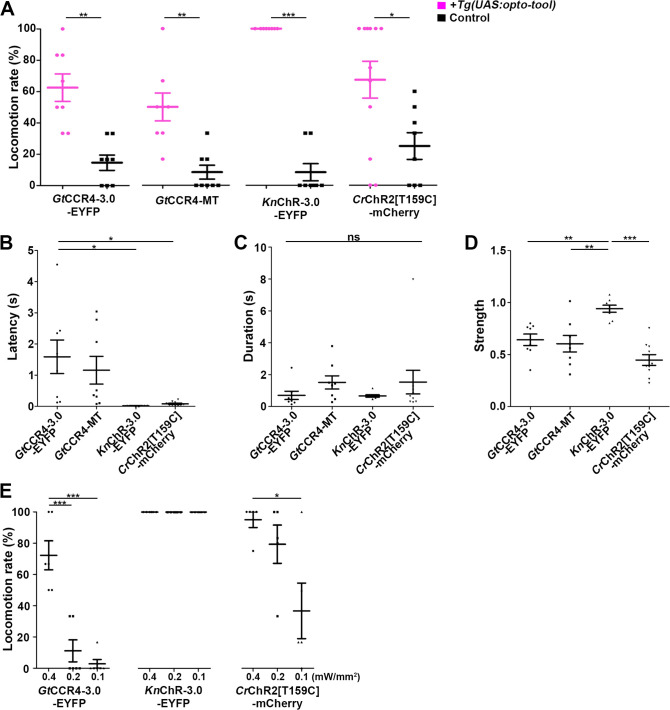
Figure 3—source data 1. Data for Figure 3, optogenetic activation of hindbrain reticulospinal V2a neurons by ChRs.

Figure 3.

Figure 3—figure supplement 1. Latency of locomotion in ChR-expressing and non-expressing larvae.

Figure 3—figure supplement 1.

The hindbrain of 3-dpf larvae expressing GtCCR4-3.0-EYFP, GtCCR4-MT, or KnChR-3.0-EYFP, and non-expressing sibling control larvae was irradiated with light (520 nm for GtCCR4-3.0-EYFP, GtCCR4-MT and 470 nm for KnChR-3.0-EYFP) for 100 ms. Six consecutive stimulation trials were analyzed for eight rhodopsin-expressing and non-expressing control larvae of each line (48 trials for each condition). Latency was measured as the tail movements observed within 8 s after the onset of light stimulation and plotted in a graph. The number of tail movements was 28 and 7 for GtCCR4-3.0-EYFP and the control, 24 and 4 for GtCCR4-MT and the control, and 25 and 4 for KnChR-3.0-EYFP and the control, respectively.
Figure 3—figure supplement 1—source data 1. Data for Figure 3—figure supplement 1, latency of locomotion in ChR-expressing and non-expressing larvae.
Figure 3—figure supplement 2. Latency and duration of locomotion induced with channelrhodopsins (ChRs) by light of various light intensities.

Figure 3—figure supplement 2.

Latency (A) and duration (B) of evoked tail movements. The hindbrain area of 3-dpf Tg larvae expressing GtCCR4-3.0, KnChR-3.0, and CrChR2[T159C] and control larvae (non-expressing sibling larvae) were irradiated by light of different light intensities. Six consecutive stimulation trials were analyzed for eight rhodopsin-expressing and non-expressing (control) larvae of each Tg line. One-way ANOVA with Tukey’s post hoc test (latency GtCCR4-3.0-EYFP 0.4 mW/mm2 vs. 0.2 mW/mm2, p=0.00571; KnChR-3.0-EYFP 0.4 mW/mm2 vs. 0.2 mW/mm2, p=0.00553; 0.4 mW/mm2 vs. 0.1 mW/mm2, p=5.26e-06; 0.2 mW/mm2 vs. 0.1 mW/mm2, p=0.00469). **p<0.01, ***p<0.001, ns: not significant. Means and SEMs are indicated.
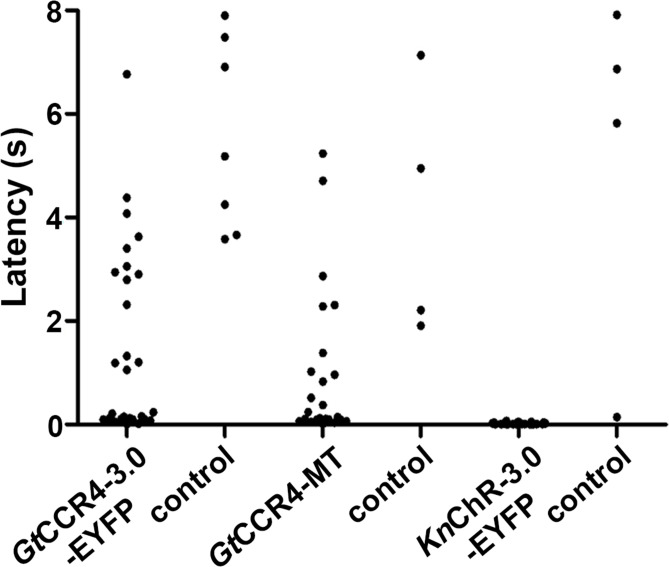
Figure 3—figure supplement 2—source data 1. Data for Figure 3—figure supplement 2, latency and duration of locomotion induced with ChRs by light of various intensities.
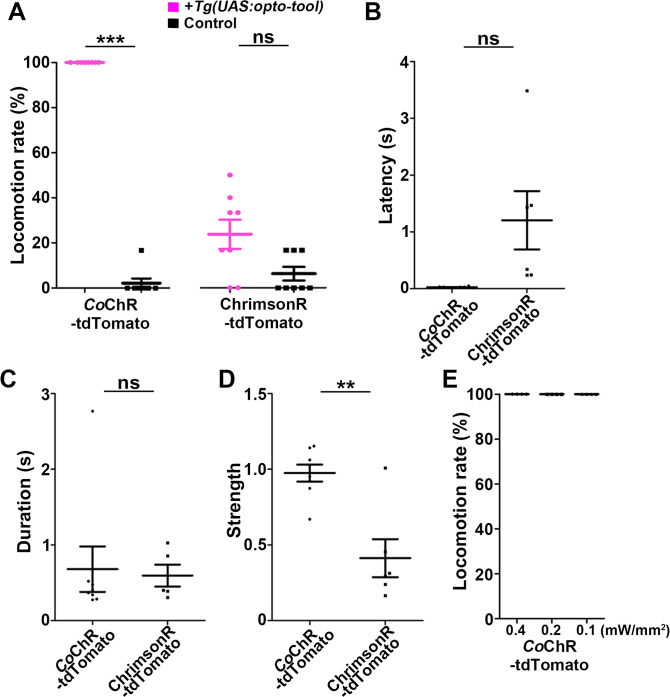
Figure 3—figure supplement 3. Optogenetic activation of hindbrain reticulospinal V2a neurons by CoChR and ChrimsonR.

Figure 3—figure supplement 3.

(A) Light stimulation-dependent locomotion rates of 3-dpf Tg larvae expressing CoChR-tdTomato and ChrimsonR-tdTomato. The hindbrain area was irradiated with light (0.4 mW/mm2) with a wavelength of 470 nm (CoChR-tdTomato) or 520 nm (ChrimsonR-tdTomato) for 100 ms. Six consecutive stimulation trials were analyzed for eight rhodopsin-expressing and eight non-expressing (control) larvae of each Tg line. The average locomotion rates for each larva are shown. Wilcoxon rank-sum test (CoChR-tdTomato vs. control, p=0.000205; ChrimsonR vs. control, p=0.0509). (B–D) Latency (B), duration (C), and strength (D) of tail movements. Welch’s t-test (strength CoChR-tdTomato vs. ChrimsonR; p=0.00463). (E) Rate of locomotion induced with CoChR-tdTomato by light of various light intensities. **p<0.01, ***p<0.001, ns: not significant. Means and SEMs are indicated.
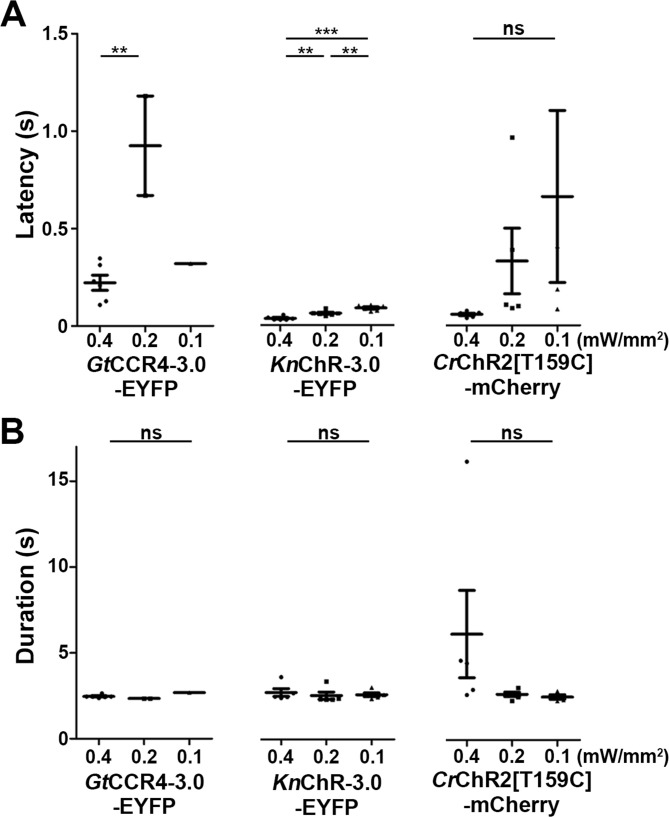
Figure 3—figure supplement 3—source data 1. Data for Figure 3—figure supplement 3, optogenetic activation of V2a neurons by CoChR and ChrimsonR.