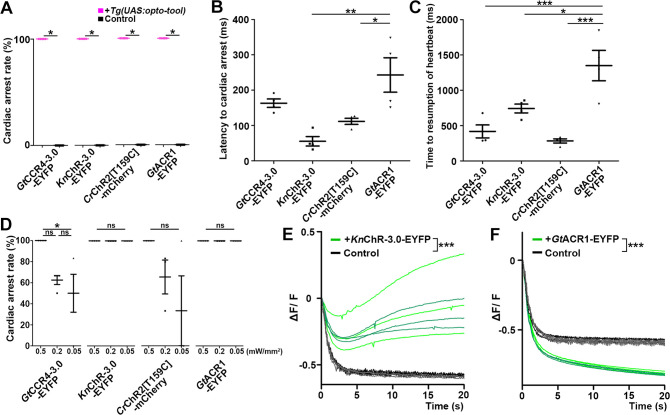
Figure 5. Cardiac arrest and resumption of heartbeats with GtCCR4-3.0, KnChR, CrChR2[T159C], and GtACR1.
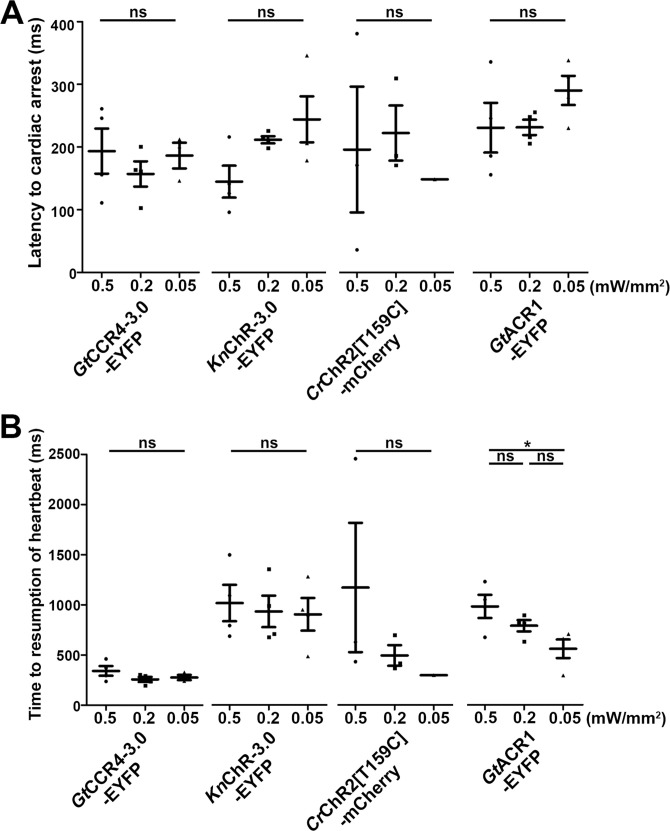
(A) Cardiac arrest rates of 4-dpf Tg larvae expressing GtCCR4-3.0-EYFP, KnChR-3.0-EYFP, CrChR2[T159C]-mCherry, or GtACR1-EYFP in cardiomyocytes. The heart area was irradiated with appropriate light (520 nm for GtCCR4 and GtACR1; 470 nm for KnChR and CrChR2) for 100 ms at a strength of 0.5 mW/mm2. Sibling larvae that did not express the rhodopsins were used as controls. Six consecutive stimulation trials were analyzed for four rhodopsin-expressing larvae and four control larvae of each Tg line, Wilcoxon rank-sum test (GtCCR4-3.0-EYFP, KnChR-3.0-EYFP, CrChR2[T159C]-mCherry, and GtACR1-EYFP, p=0.0131). (B, C) Latency to cardiac arrest (B) and time to resumption of HBs (C) after light stimulation with GtCCR4-3.0-EYFP, KnChR-3.0-EYFP, CrChR2[T159C]-mCherry, or GtACR1-EYFP. HB data were obtained from the experiments described above (A). One-way ANOVA with Tukey’s post hoc test (latency to cardiac arrest KnChR-3.0-EYFP vs. GtACR1-EYFP, p=0.00144; CrChR2[T159C]-mCherry vs. GtACR1-EYFP, p=0.0190; time to resumption of heartbeat GtCCR4-3.0-EYFP vs. GtACR1-EYFP, p=0.000786; KnChR-3.0-EYFP vs. GtACR1-EYFP, p=0.0189; CrChR2[T159C]-mCherry vs. GtACR1-EYFP, p=0.000236). (D) Light intensity dependence of cardiac arrest rates of 4-dpf Tg larvae expressing GtCCR4-3.0-EYFP, KnChR-3.0-EYFP, CrChR2[T159C]-mCherry, GtACR1-EYFP in cardiomyocytes. The heart area was irradiated with light (520 nm for GtCCR4 and GtACR1; 470 nm for KnChR and CrChR2) for 100 ms at a strength of 0.5, 0.2, or 0.05 mW/mm2. Six consecutive stimulation trials were analyzed for four rhodopsin-expressing larvae of each Tg line. One-way ANOVA with Tukey’s post hoc test (GtCCR4-3.0-EYFP: 0.5 mW/mm2 vs. 0.05 mW/mm2; p=0.0222). (E, F) Changes in fluorescence intensity of GCaMP6s (ΔF/F) in the heart of 4-dpf Tg larvae expressing KnChR-3.0-EYFP and GCaMP6s (E), or GtACR1-EYFP and GCaMP6s (F). Sibling larvae that did not express the rhodopsins were used as the control. The heart area of Tg larvae was stimulated with a fluorescence detection filter (excitation 470–495 nm, emission 510–550 nm). Two rhodopsin-expressing larvae (green) and two control larvae (black) were analyzed for each rhodopsin. Three trials were analyzed for each larva. The linear mixed-effects model was used for statistical analysis. *p<0.05, **p<0.01, ***p<0.001, ns: not significant. Means and SEMs are indicated.


