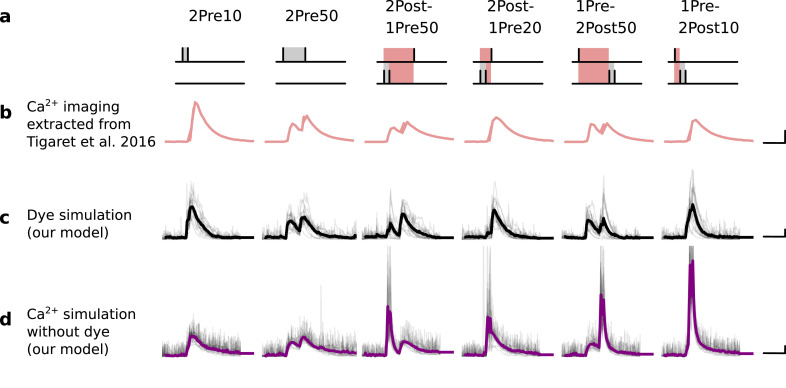
Figure 12. Differences between dye measurements and simulated calcium.
(a), Pre and postsynaptic stimuli as used in Tigaret et al., 2016. (b), Calcium imaging curves (fluorescence ΔF/A) elicited using the respective stimulation protocols above with Fluo5 200 μM (extracted from Tigaret et al., 2016). Scale 100 ms, 0.05 ΔF/A. (c), Dye simulation using the model. The dye is implemented by increasing temperature to mimic laser effect on channel kinetics and decreases the interaction between NMDAr and voltage elicited by BaP. Temperature effects over NMDAr are shown in Korinek et al., 2010. Also, the effects of temperature on calcium-sensitive probes shown in Oliveira et al., 2012 (baseline only, likely related to T-type channels). Other examples of laser heating of neuronal tissue are given in Deng et al., 2014. Such a dye curve fitting was obtained by increasing temperature by 10°C to mimic laser-induced heating (Wells et al., 2007; Deng et al., 2014). We achieved a better fit by decreasing the amplitude of the BaP that reaches the dendrite. Additionally, for fitting purposes, we assumed that a temperature increase lead to a decrease in BaP amplitude. Scale 0.6 µM dye, 100 ms. (d), Calcium simulation without dye. Scale 0.85 µM Ca2+, 100 ms.

