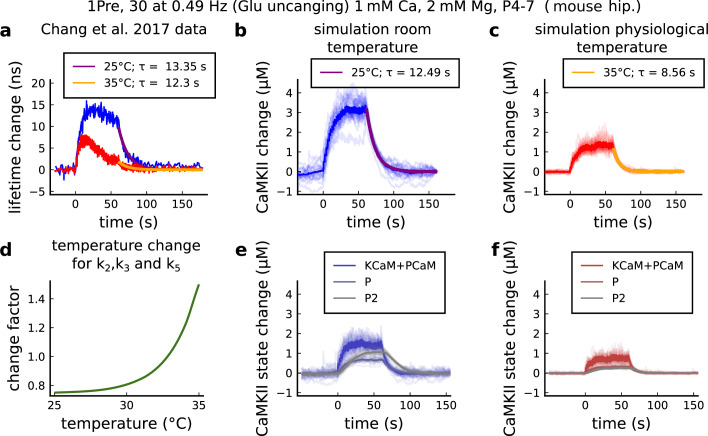
Figure 19. CaMKII temperature changes in the model caused by 1Pre, 30 at 0.49 Hz with glutamate uncaging (no failures allowed), 1 mM Ca, 2 mM Mg, P4-7 organotypic slices from mouse hippocampus.
(a) CaMKII fluorescent probe lifetime change measured by Chang et al., 2017 for 25°C (blue) and 35°C (red). The decay time () was estimated by fitting the decay after the stimulation (30 pulses at 0.49 Hz) using a single exponential decay, .(b) Simulation of the CaMKII concentration change (with respect to the baseline) at 25°C in response to same protocol applied in the panel a. The simulations on the panels b, c, e, f show the mean of 20 samples. (c) Same as in panel b but for 35°C. (d) Estimated temperature change factor for the dissociation rates , , and in the Markov chain in Figure 18. (e) Change in the concentration of the CaMKII states (25°C) which are summed to compose CaMKII change in the panel b. (f) Same as in panel e for 35°C with reference to the panel c.

