. 2023 Aug 17;12:e80152. doi: 10.7554/eLife.80152

Figure 3. Read-out strategy to accurately model Tigaret et al., 2016 experiment.

(a) Illustration of the joint CaMKII and CaN activities crossing the plasticity regions. Arrows indicate the flow of time, starting at the filled black circle. (b) Region indicator showing when the joint CaN and CaMKII activity crosses the LTD or LTP regions in panel a. For example, the LTP indicator is such that 1LTP(x)=1 if xLTP and 0 otherwise. Leaving the region activates a mechanism with a slow timescale that keeps track of the accumulated time inside the region. Such mechanism drives the transition rates used to predict plasticity (Materials and methods). (c), Plasticity Markov chain with three states: LTD, LTP and NC. There are only two transition rates which are functions of the plasticity region indicator (Materials and methods). The LTP transition is fast, whereas the LTD transition is slow, meaning that LTD change requires longer time inside the LTD region (panel a). The NC state starts with 100 processes. See Figure 23 for more details on the dynamics of the Plasticity Markov Chain. (d) Joint CaMKII and CaN activity for all protocols in Tigaret et al., 2016 (shown in panel f). The stimulus ends when the trajectory becomes smooth. Trajectories correspond to those in Figure 2b, e and h, at 60 s. (e) Region indicator for the protocols in panel f. The upper square bumps are caused by the protocol crossing the LTP region, the lower square bumps when the protocol crosses the LTD region (as in panel d). (f) Synaptic weight (%) as function of time for each protocol. The weight change is defined as the number (out of 100) of states in the LTP state minus the number of states in the LTD state (panel c). The trajectories correspond to the median of the simulations in panel g. (g) Synaptic weight change (%) predicted by the model compared to data (EPSC amplitudes) from Tigaret et al., 2016 (100 samples for each protocol, also for panel h and i). The data (filled grey circles) was provided by Tigaret et al., 2016 (note an 230% outlier as the red asterisk). (h) Predicted mean synaptic weight change (%) as a function of delay (ms) and number of pairing repetitions (pulses) for the protocol 1Pre2Post(delay), where delays are between –100 and 100 ms. LTD is induced by 2Post1Pre50 after at least 500 pulses. The mean weight change along the horizontal dashed line is reported in the STDP curves in panel i. (i) Synaptic weight change (%) as a function of pre-post delay. Each plot corresponds to a different pairing repetition number (color legend). The solid line shows the mean, and the ribbons are the 2nd and 4th quantiles. The filled grey circles are the data means estimated in Tigaret et al., 2016, also shown in panel g.

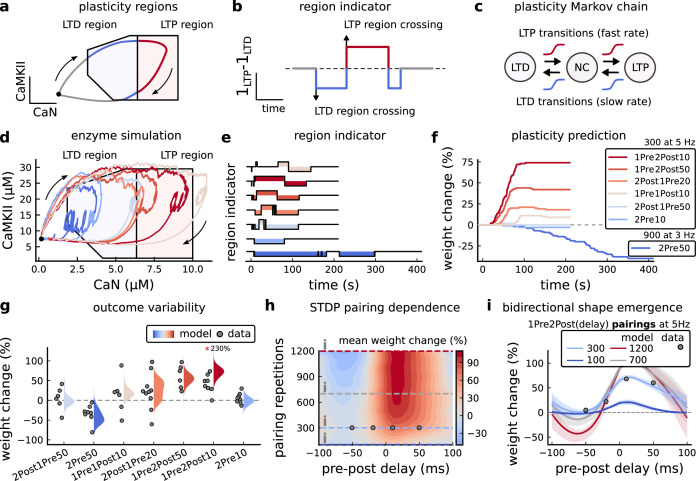
Figure 3.

Figure 3—figure supplement 1. Comparison showing different roles of stochasticity in the model.

Figure 3—figure supplement 1.

(a) Left, Glutamate concentration from a single realization of the model (yellow) and averaged Glutamate concentration (purple) from 100 repetitions of the model for 300 pulses train at 5 Hz. Right, 1Pre1Post10 from Tigaret et al., 2016 using the model (yellow) and a version of the model (purple) in which the glutamate concentration is the average one (as in Left panel). The time spent (s) is shown for the different glutamate release modes (stochastic and averaged) with an example trajectory (purple and solid yellow lines). There are no failures in averaged release; therefore, enzymes are over-activated. (b) A comparison between our model and a fully deterministic version for the 1Pre1Post10 from Inglebert et al., 2020. Note the significant mismatch, which does not allow the deterministic model to reach the LTP region that determines the plasticity outcome. This effect is mainly caused by the stochastic calcium sources, which the deterministic model fails to reproduce. The black triangle (circle) marks the initial conditions of the deterministic model. This initial condition is reached by letting the model evolve with no input. (c) The initial conditions are increasingly different when comparing the model and its fully deterministic version for rising concentrations of external calcium concentrations.
Figure 3—figure supplement 2. Effects of blocking VGCCs.

Figure 3—figure supplement 2.

(a), Combined enzyme activity of the experiment 1Pre2Post10, 300 at 5 Hz described in Tigaret et al., 2016 with and without VGCCs (legend in panel c). The arrows indicate time flow, and the grey and black dots represent the initial conditions. Note the effect of VGCC blocking on the initial conditions. (b), Region indicator associated to panel a. (c) Plasticity prediction for the simulated experiment with and without VGCCs. Note that when VGCCs are blocked LTP cannot be induced, in agreement with Tigaret et al., 2016 experimental data.
Figure 3—figure supplement 3. Exclusively setting vertical boundaries (no CaMKII selectivity) fails to capture the correct plasticity outcome.

Figure 3—figure supplement 3.

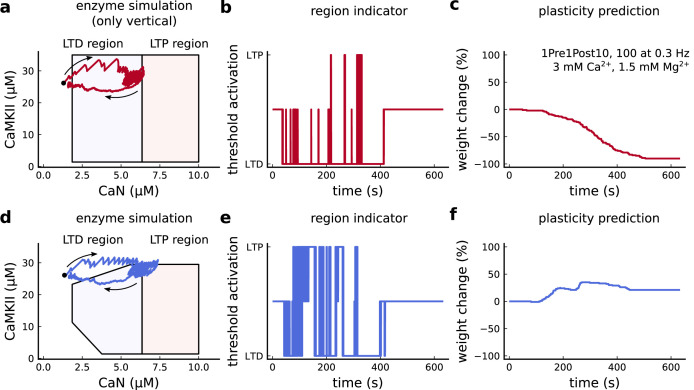
(a) Combined activity of the protocol 1Pre1Post10, 100 at 0.3 Hz with experimental conditions as in Figure 6c considering the polygonal regions responding only to CaN thresholds. Note that most of the activity resides in the LTD region. The arrows indicate time flow and black dot represents the initial condition. (b) Region indicator related to panel a. (c) Plasticity prediction shows LTD, instead of LTP. (d) Same as a but considering the plasticity regions sensitivity both to CaMKII and CaN. (e) Region indicator related to panel d. (f) Plasticity prediction for panel d showing LTP agreeing with data described in Figure 6c.
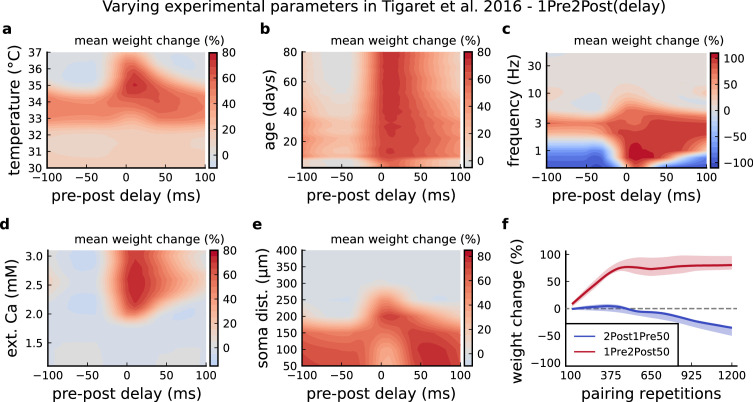
Figure 3—figure supplement 4. Varying Tigaret et al., 2016 experimental parameters.

Figure 3—figure supplement 4.

(a) Mean synaptic weight change for 1Pre2Post(delay) varying the temperature. (b) Mean synaptic weight change for 1Pre2Post(delay) varying the age. (c) Mean synaptic weight change for 1Pre2Post(delay) varying the frequency. (d) Mean synaptic weight change for 1Pre2Post(delay) varying the [Ca2+]o. (e) Mean synaptic weight change for 1Pre2Post(delay) varying the distance from the soma. A similar trend in distal spines was previously found in Ebner et al., 2019. (f) Mean synaptic weight change of 1Pre2Post50 and 2Post1Pre50 when number of pulses increases or decreases. Note the similarity with Mizuno et al., 2001 in Figure 6—figure supplement 1f .