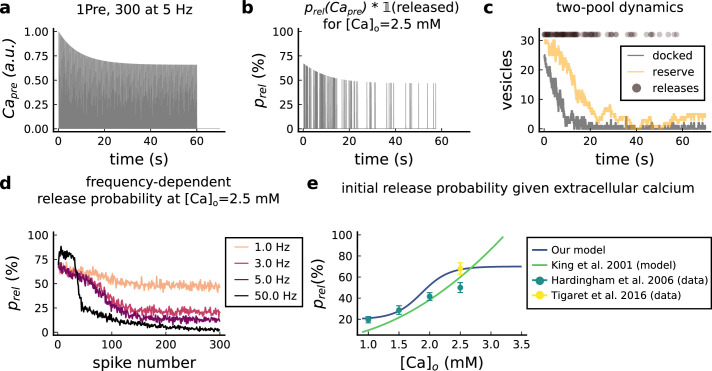
Figure 8. Presynaptic release model validation.
(a) Presynaptic calcium in response to the protocol 1Pre, 300 pulses at 5 Hz displaying adaptation. (b) Release probability for the same protocol as panel A but subjected to the docked vesicles availability. (c) Number of vesicles in the docked and reserve pools under depletion caused by the stimulation from panel a. (d) Plot of the mean (300 samples) release probability (%) for different frequencies for the protocol 1Pre 300 pulses at [Ca2+]o = 2.5 mM. (e) Release probability (%) for a single presynaptic spike as a function of [Ca2+]o. Note that King et al., 2001 model was multiplied by the experimentally measured release probability at [Ca2+]o = 2 mM since their model has this calcium concentration as the baseline.

